File list
This special page shows all uploaded files.
First page |
Previous page |
Next page |
Last page |
| Date | Name | Thumbnail | Size | Description | Versions |
|---|---|---|---|---|---|
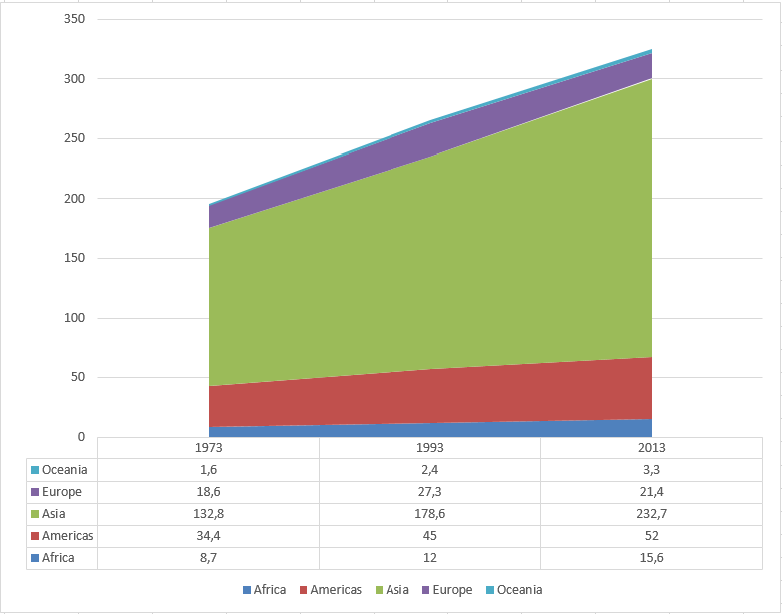
| 19:46, 23 November 2017 | Total worldwide area equipped for irrigation. In million hectares. Cumulative..png (file) |  |
22 KB | Total worldwide area equipped for irrigation. In million hectares. Cumulative.<ref>{{cite web|title=Area equipped for irrigation and percentage of cultivated land|url=http://www.fao.org/nr/water/aquastat/tables/WorldData-Irrigation_eng.pdf|website=fao.... | 1 |
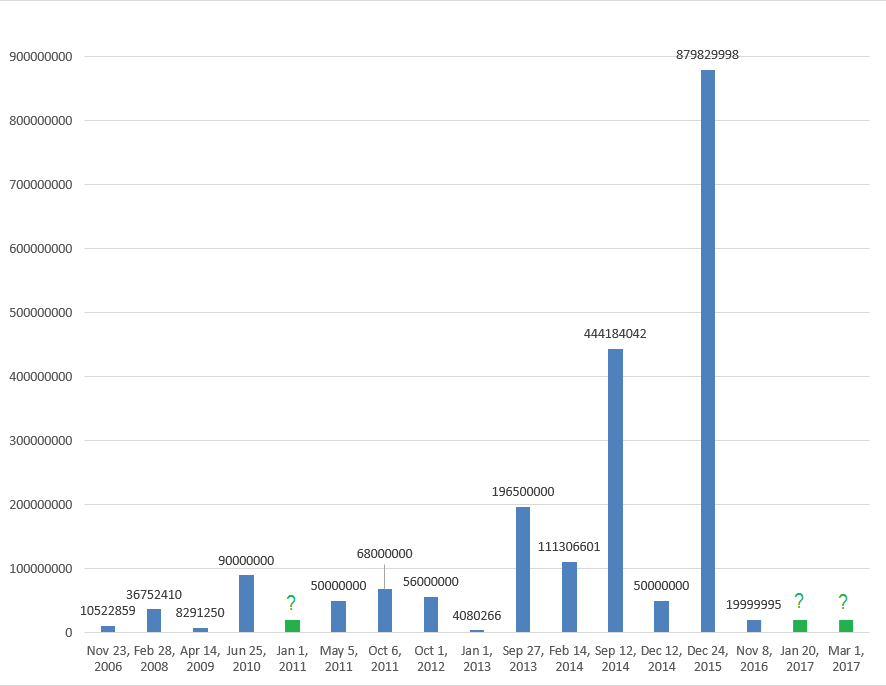
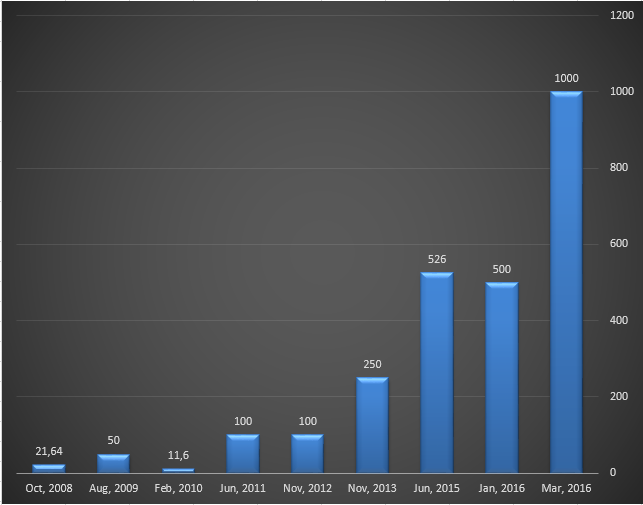
| 21:28, 14 November 2017 | Money raised per funding round for Palantir Technologies.png (file) |  |
21 KB | Money raised by Palantir Technologies, per funding round.<ref>{{cite web|title=Palantir Technologies Funding Rounds|url=https://www.crunchbase.com/organization/palantir-technologies/funding_rounds/funding_rounds_list|website=crunchbase.com|accessdate=... | 1 |
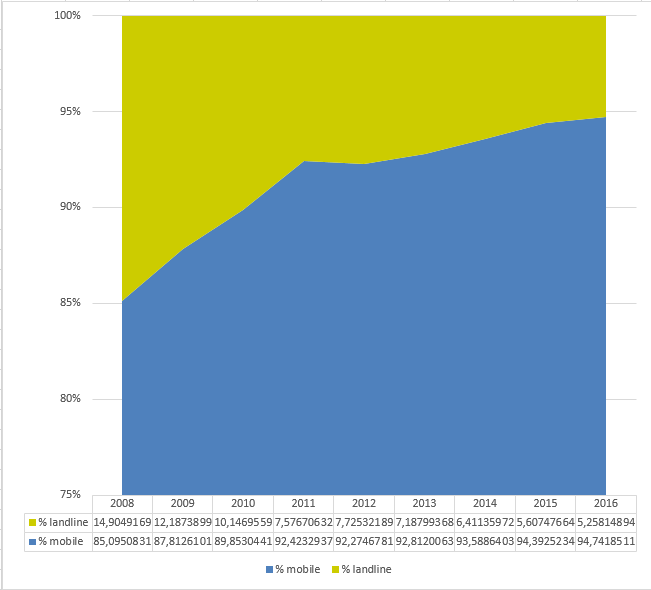
| 13:10, 25 October 2017 | Proportion of telephone calls made in Finland from 2007 to 2016, by type of connection (in millions).png (file) | .png) |
17 KB | Proportion of telephone calls made in Finland from 2007 to 2016, by type of connection (in millions).<ref>{{cite web|title=Volume of telephone calls made in Finland from 2007 to 2016, by type of connection (in millions)|url=https://www.statista.com/sta... | 1 |
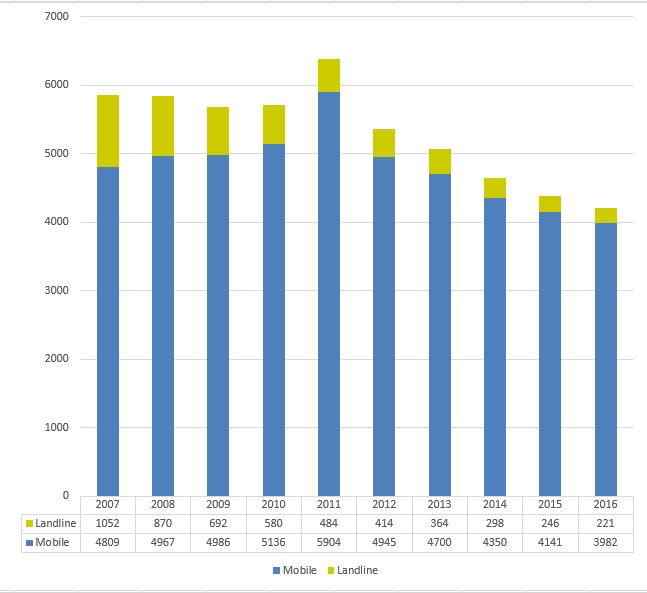
| 13:09, 25 October 2017 | Volume of telephone calls made in Finland from 2007 to 2016, by type of connection (in millions).png (file) | .png) |
27 KB | Volume of telephone calls made in Finland from 2007 to 2016, by type of connection (in millions).<ref>{{cite web|title=Volume of telephone calls made in Finland from 2007 to 2016, by type of connection (in millions)|url=https://www.statista.com/statist... | 1 |
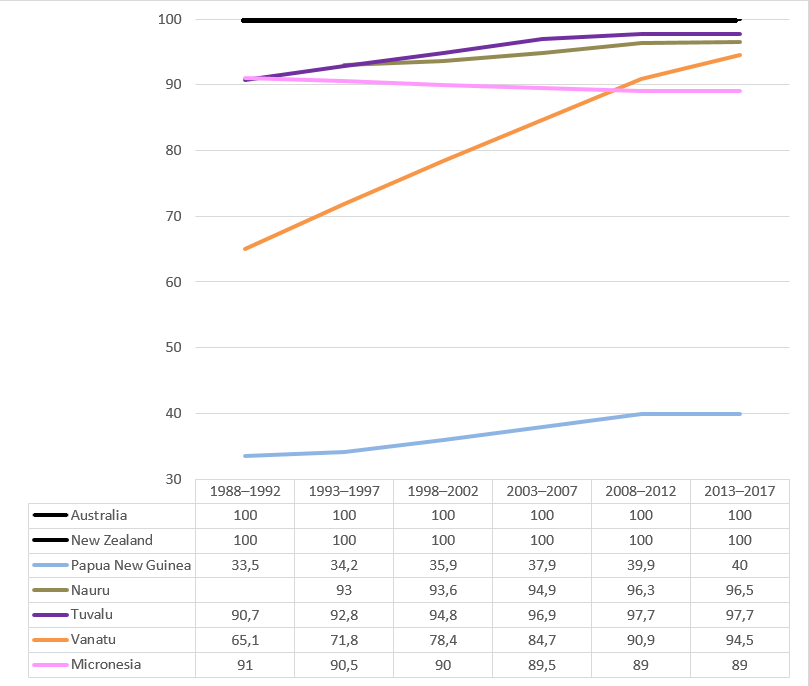
| 11:33, 23 October 2017 | Percentage of population with access to safe drinking water among countries in Oceania..png (file) |  |
29 KB | Percentage of population with access to safe drinking water among countries in Oceania..<ref>{{cite web|title=Select Environment and health -> Access to improved drinking water source -> Total population with access to safe drinking water|url=http://ww... | 1 |
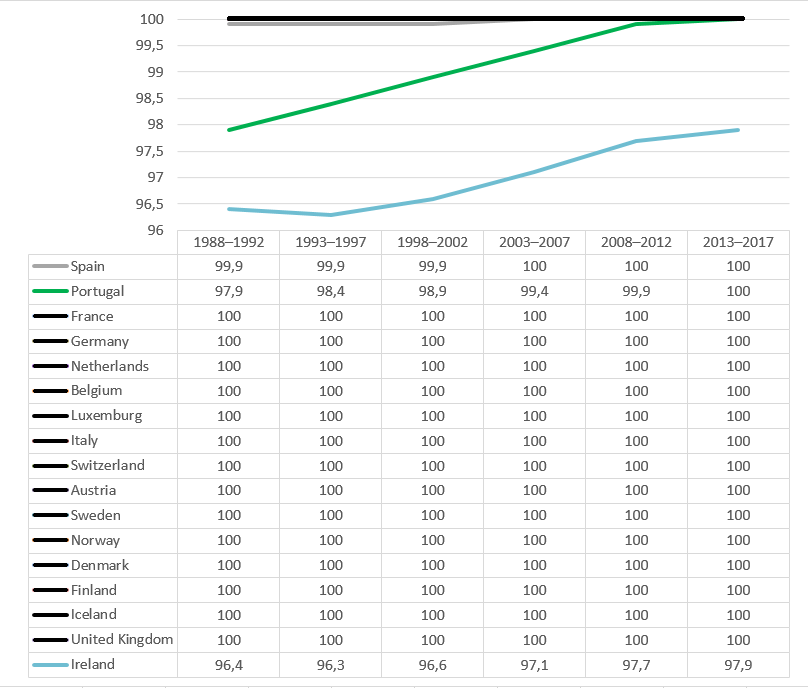
| 22:46, 22 October 2017 | Percentage of population with access to safe drinking water in advanced European economies..png (file) |  |
41 KB | Percentage of population with access to safe drinking water in advanced European economies.<ref>{{cite web|title=Select Environment and health -> Access to improved drinking water source -> Total population with access to safe drinking water|url=http:/... | 1 |
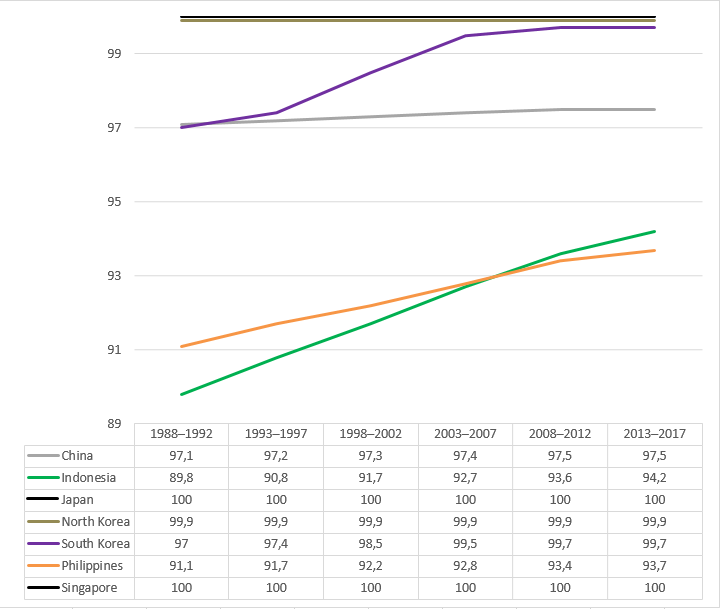
| 19:18, 22 October 2017 | Percentage of population with access to safe drinking water among countries in continental and insular East Asia..png (file) |  |
27 KB | Percentage of population with access to safe drinking water among countries in continental and insular East Asia.<ref>{{cite web|title=Select Environment and health -> Access to improved drinking water source -> Total population with access to safe dri... | 1 |
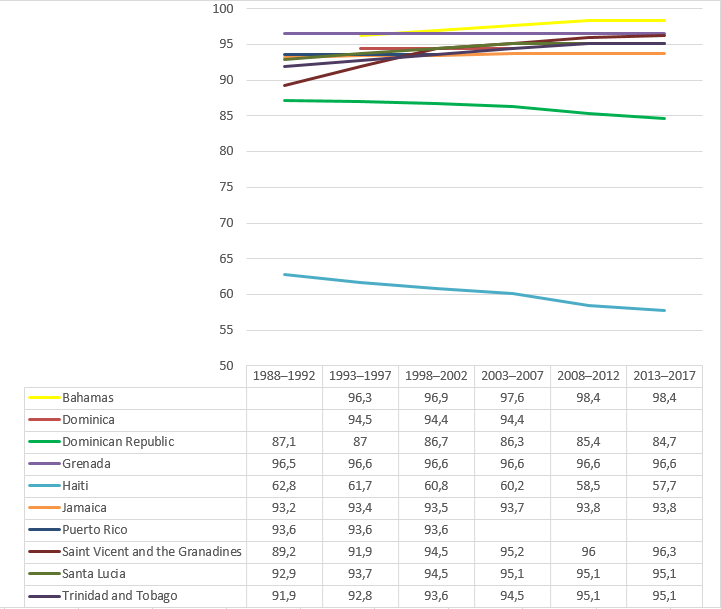
| 18:03, 22 October 2017 | Percentage of population with access to safe drinking water among American insular countries..png (file) |  |
33 KB | 2 | |
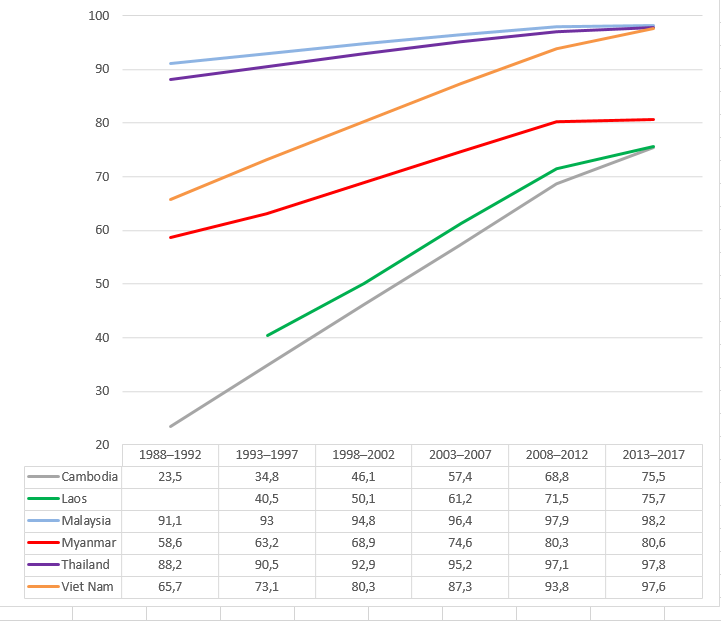
| 17:56, 22 October 2017 | Percentage of population with access to safe drinking water among countries in continental South East Asia..png (file) |  |
33 KB | Percentage of population with access to safe drinking water among countries in continental South East Asia.<ref>{{cite web|title=Total population with access to safe drinking-water|url=http://www.fao.org/nr/water/aquastat/data/query/results.html|websit... | 1 |
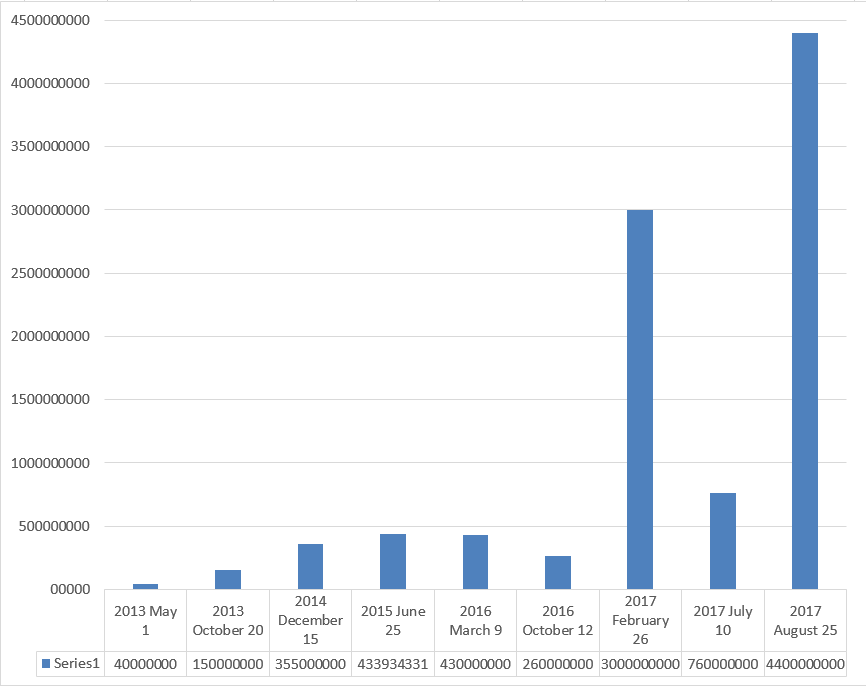
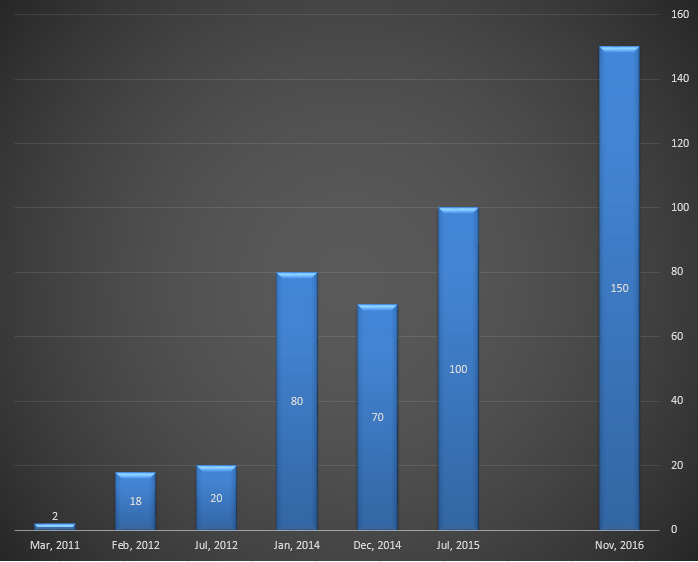
| 11:42, 20 October 2017 | Funding Rounds for WeWork, in US$..png (file) |  |
22 KB | Funding Rounds for WeWork, in US$. <ref>{{cite web|title=WeWork|url=https://www.crunchbase.com/organization/wework|website=crunchbase.com|accessdate=20 October 2017}}</ref> | 1 |
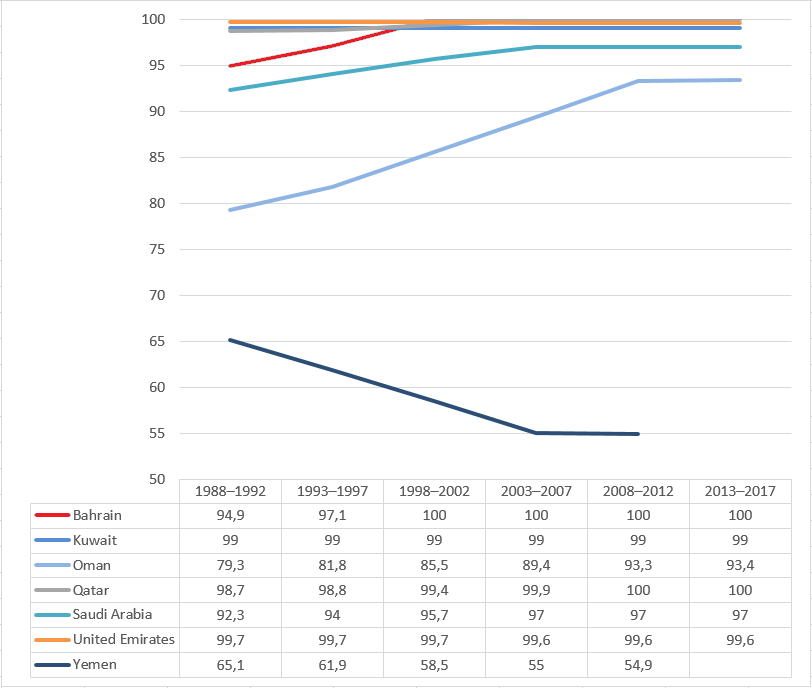
| 15:35, 18 October 2017 | Percentage of population with access to safe drinking water among countries in the Arabian peninsula..png (file) |  |
30 KB | Percentage of population with access to safe drinking water among countries in the Arabian peninsula.<ref>{{cite web|title=Total population with access to safe drinking-water|url=http://www.fao.org/nr/water/aquastat/data/query/results.html|website=fao.... | 1 |
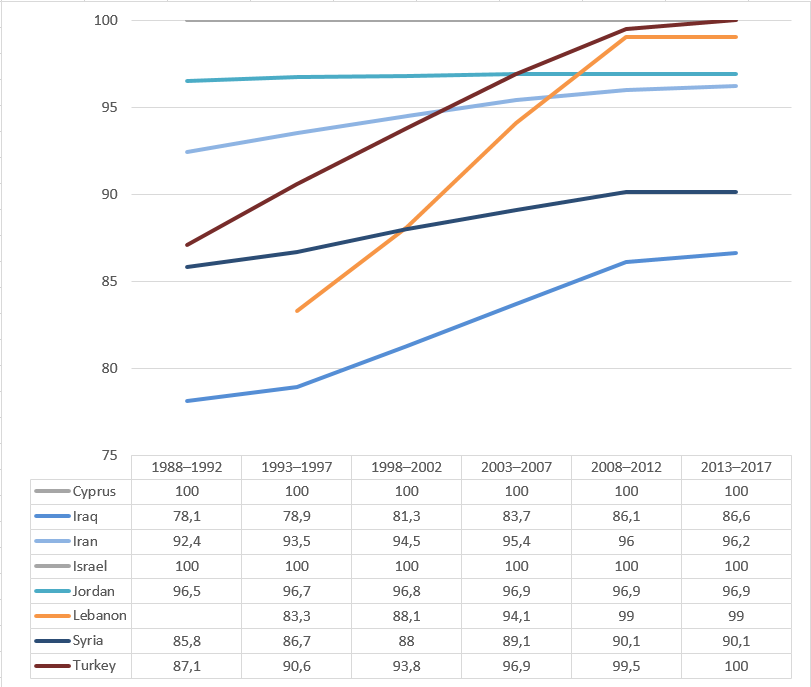
| 15:04, 18 October 2017 | Percentage of population with access to safe drinking water among countries in West Asia..png (file) |  |
38 KB | Percentage of population with access to safe drinking water among countries in West Asia. Israel and Cyprus, both in grey, share the same percentage at 100% coverage in all the reported periods.<ref>{{cite web|title=Total population with access to safe... | 1 |
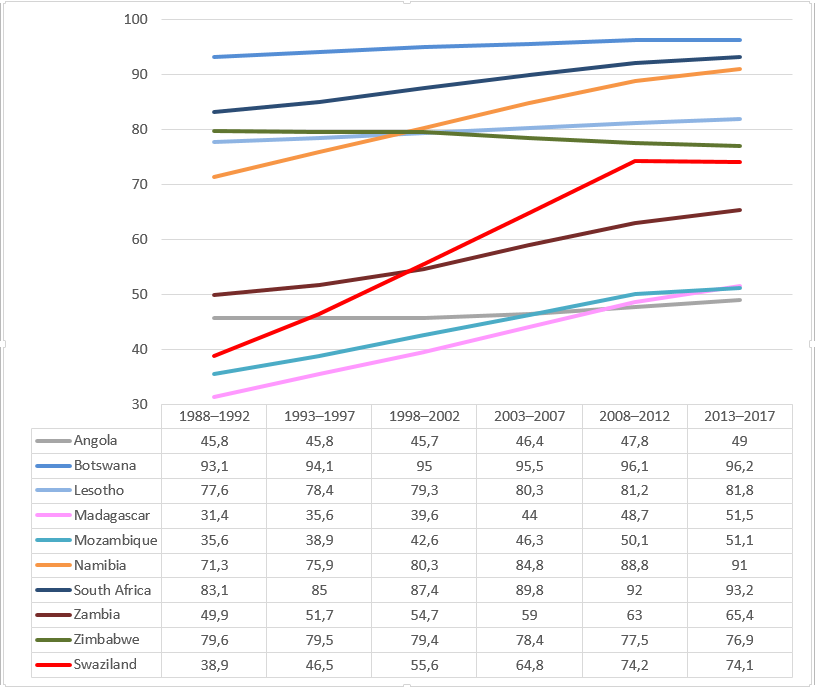
| 14:58, 18 October 2017 | Percentage of population with access to safe drinking water among countries in Southern Africa..png (file) |  |
46 KB | Improved | 2 |
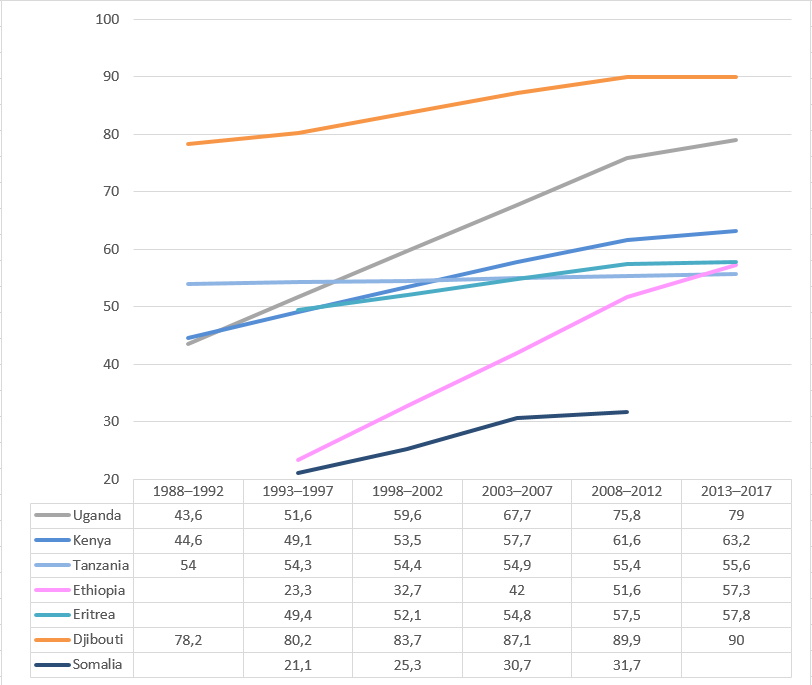
| 14:28, 18 October 2017 | Percentage of population with access to safe drinking water among countries in Eastern Africa..png (file) |  |
34 KB | This is the correct graph | 2 |
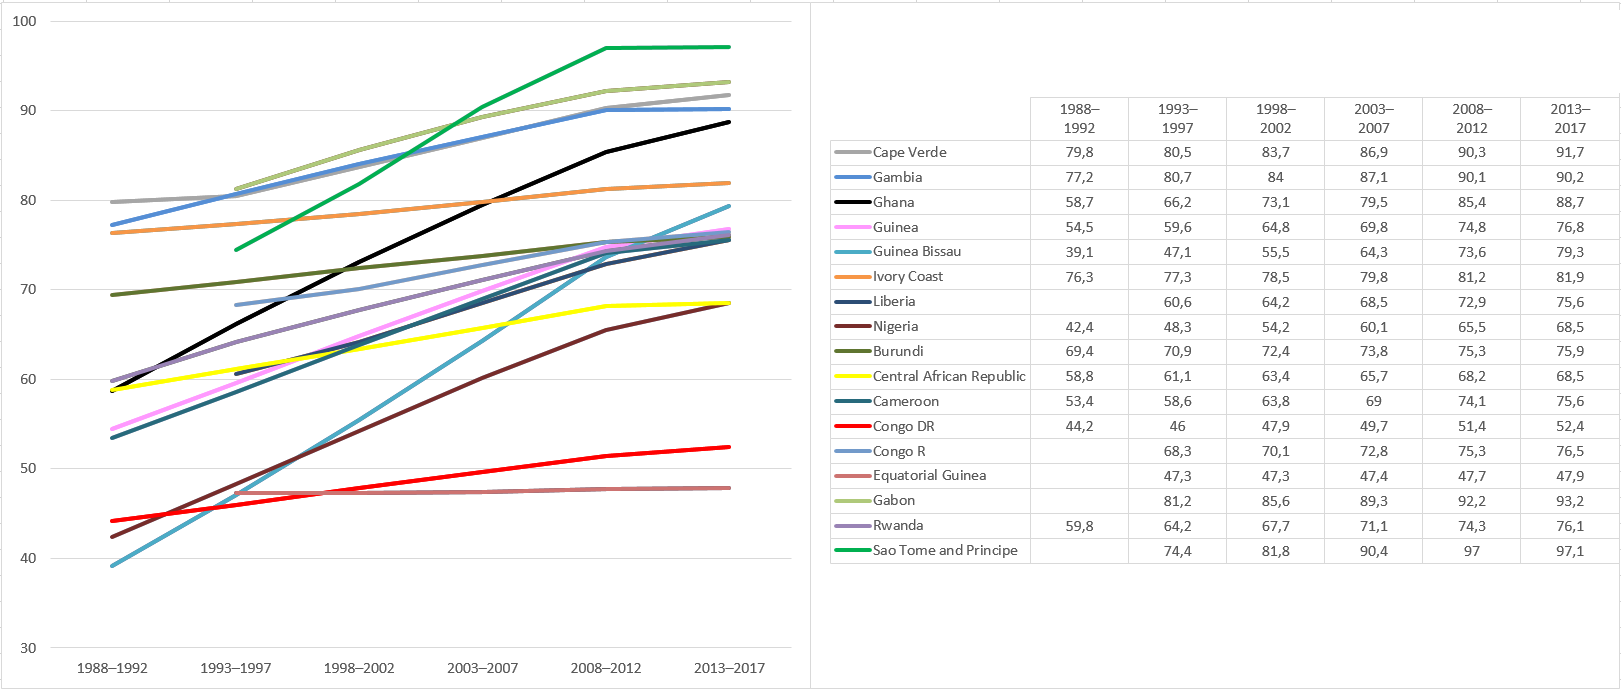
| 13:40, 18 October 2017 | Percentage of population with access to safe drinking water among countries in Central Africa..png (file) |  |
106 KB | Percentage of population with access to safe drinking water among countries in Central Africa.<ref>{{cite web|title=Total population with access to safe drinking-water|url=http://www.fao.org/nr/water/aquastat/data/query/results.html|website=fao.org|acc... | 1 |
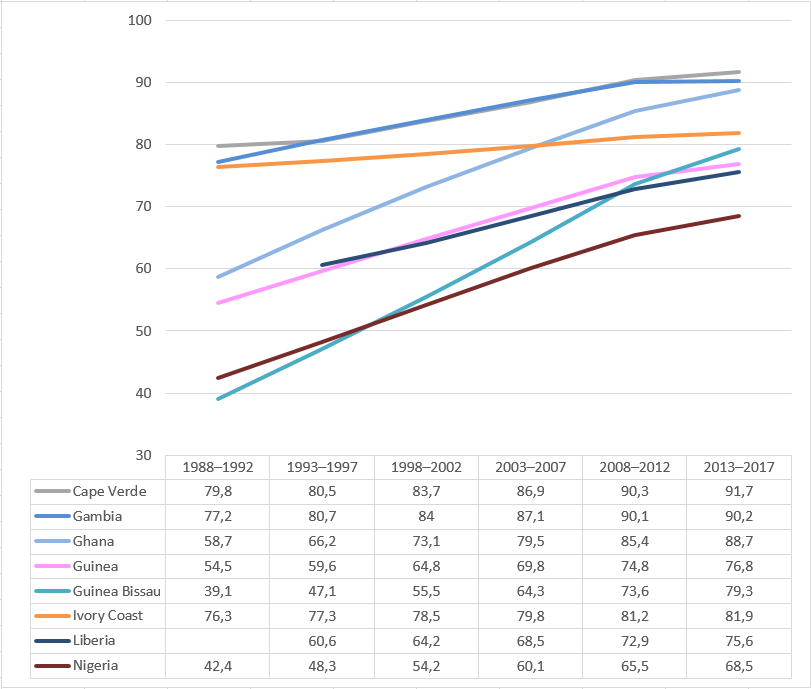
| 13:18, 18 October 2017 | Percentage of population with access to safe drinking water among countries in Western Africa..png (file) |  |
42 KB | Percentage of population with access to safe drinking water among countries in Western Africa.<ref>{{cite web|title=Total population with access to safe drinking-water|url=http://www.fao.org/nr/water/aquastat/data/query/results.html|website=fao.org|acc... | 1 |
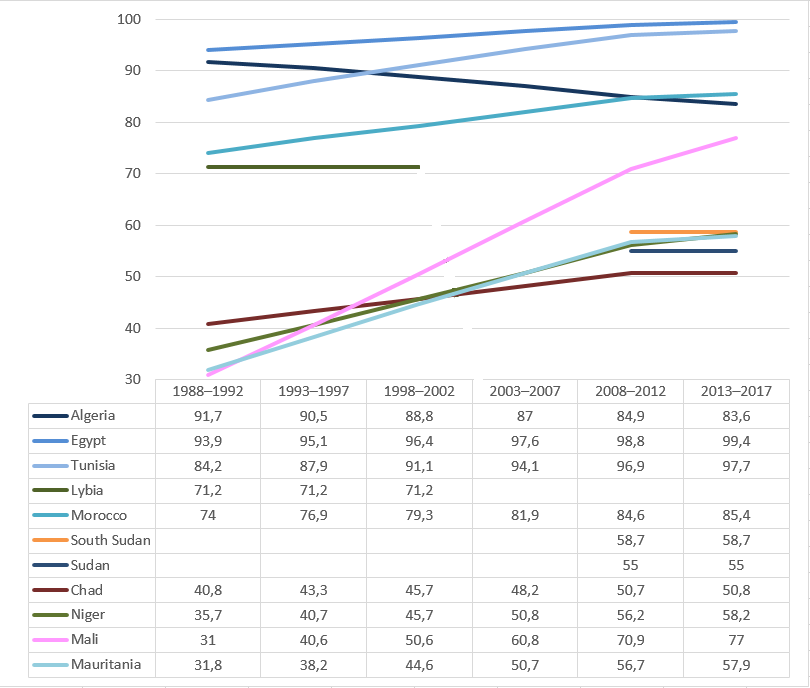
| 12:21, 18 October 2017 | Percentage of population with access to safe drinking water among Northern African countries..png (file) |  |
43 KB | Percentage of population with access to safe drinking water among contries in Northern Africa.<ref>{{cite web|title=Total population with access to safe drinking-water|url=http://www.fao.org/nr/water/aquastat/data/query/results.html|website=fao.org|acc... | 1 |
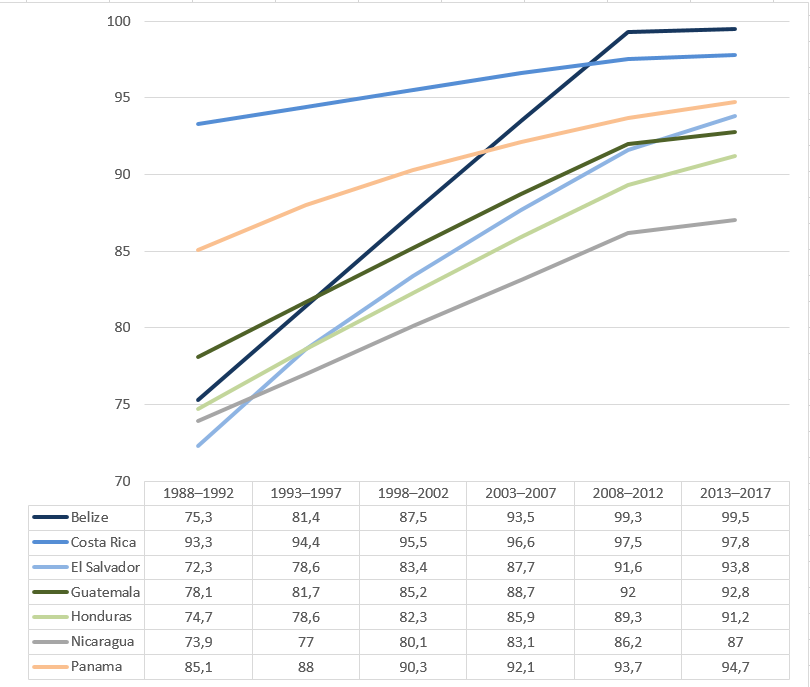
| 07:27, 18 October 2017 | Percentage of population with access to safe drinking water among Central American countries..png (file) |  |
47 KB | Percentage of population with access to safe drinking water among Central American countries.<ref>{{cite web|title=Total population with access to safe drinking-water|url=http://www.fao.org/nr/water/aquastat/data/query/results.html|website=fao.org|acce... | 1 |
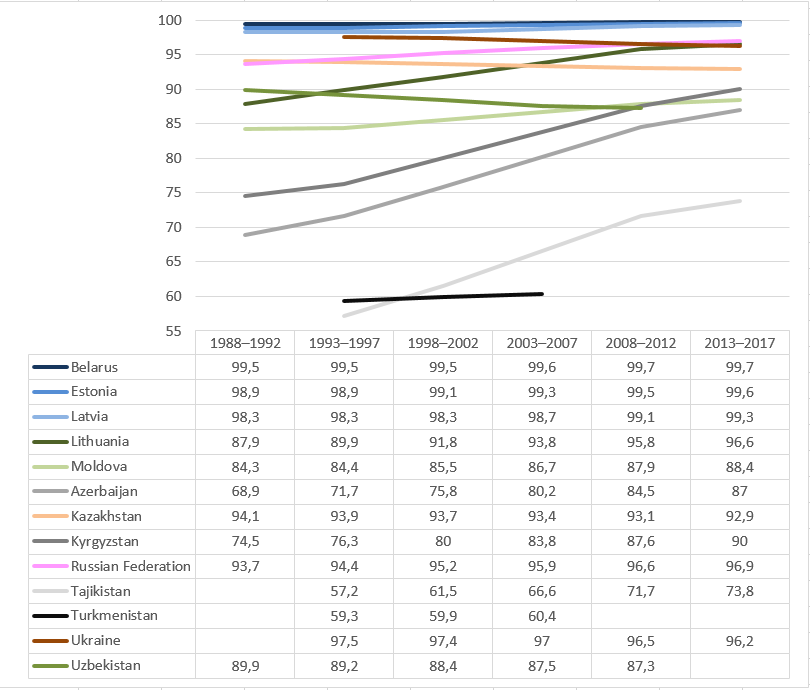
| 20:07, 17 October 2017 | Percentage of population with access to safe drinking water among countries belonging to the ex USSR..png (file) |  |
48 KB | Percentage of population with access to safe drinking water among countries belonging to the ex USSR.<ref>{{cite web|title=Total population with access to safe drinking-water|url=http://www.fao.org/nr/water/aquastat/data/query/results.html|website=fao.... | 1 |
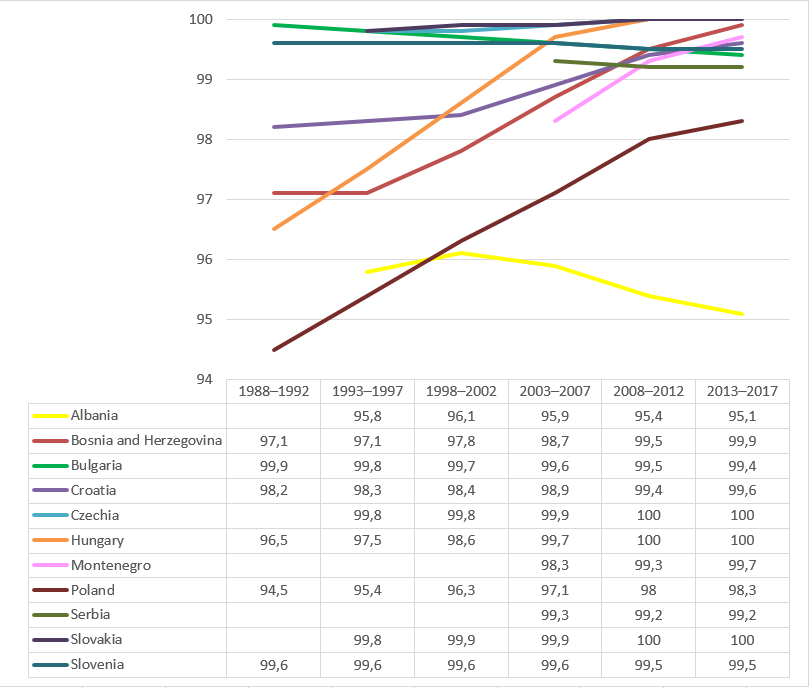
| 20:02, 17 October 2017 | Percentage of population with access to safe drinking water among countries from Eastern Europe..png (file) |  |
46 KB | Percentage of population with access to safe drinking water among countries from Eastern Europe.<ref>{{cite web|title=Total population with access to safe drinking-water|url=http://www.fao.org/nr/water/aquastat/data/query/results.html|website=fao.org|a... | 1 |
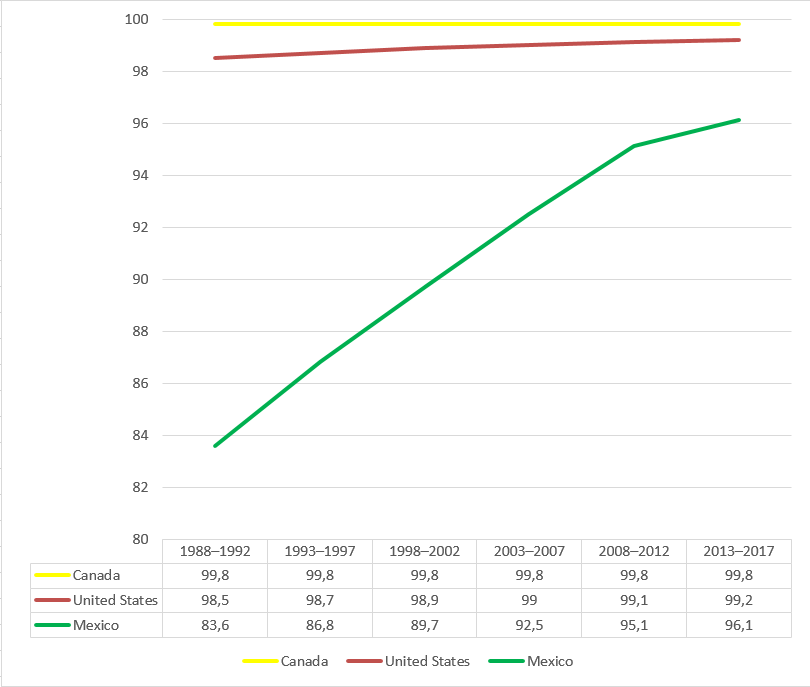
| 15:12, 17 October 2017 | Percentage of population with access to safe drinking water among countries in North America..png (file) |  |
19 KB | Percentage of population with access to safe drinking water among countries in North America.<ref>{{cite web|title=Total population with access to safe drinking-water|url=http://www.fao.org/nr/water/aquastat/data/query/results.html|website=fao.org|acce... | 1 |
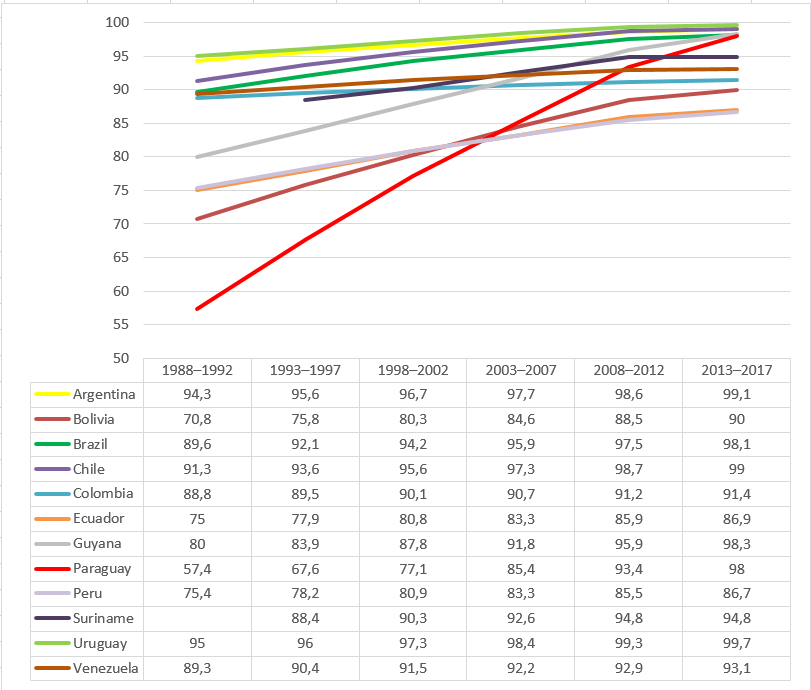
| 15:03, 17 October 2017 | Percentage of population with access to safe drinking water among South American countries..png (file) |  |
53 KB | Percentage of population with access to safe drinking water among South American countries.<ref>{{cite web|title=Total population with access to safe drinking-water|url=http://www.fao.org/nr/water/aquastat/data/query/results.html|website=fao.org|access... | 1 |
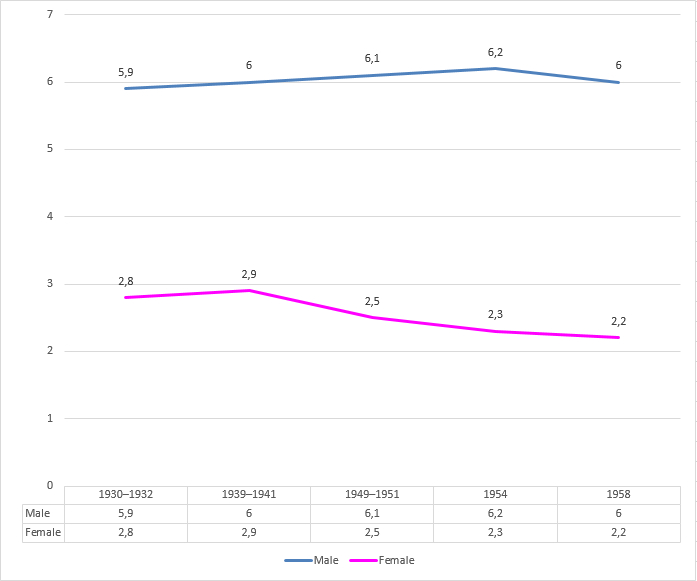
| 11:26, 13 October 2017 | Age–adjusted death rates from bladder cancer, by sex, in the United States, 1930–1958..png (file) |  |
11 KB | Age–adjusted death rates from bladder cancer, by sex, in the United States, 1930–1958.<ref>{{cite web|title=THE RELATIONSHIP OF BLADDER CANCER TO SMOKING|url=https://www.ncbi.nlm.nih.gov/pmc/articles/PMC1255078/pdf/amjphnation00178-0066.pdf|website... | 1 |
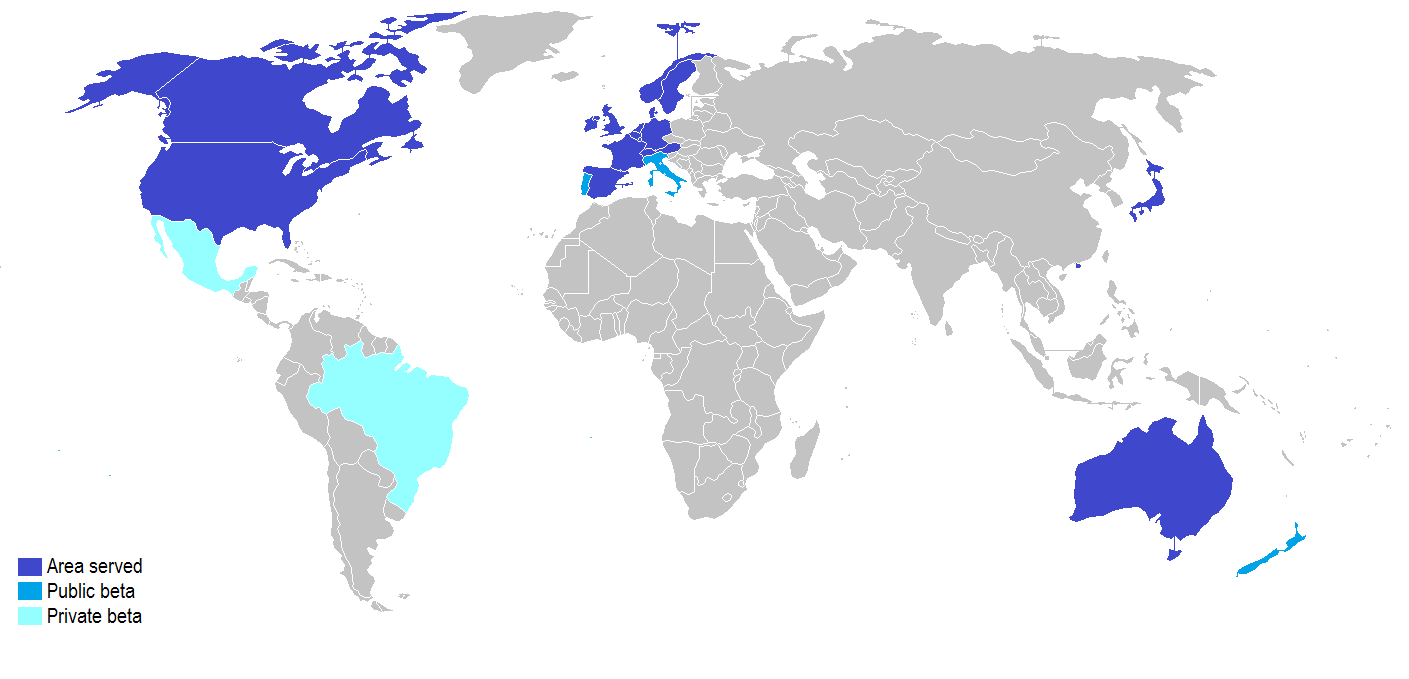
| 08:47, 10 October 2017 | Stripe coverage as of October 2017.png (file) |  |
41 KB | Stripe coverage as of October 2017.<ref>{{cite web|title=Available for businesses in 25 countries.|url=https://stripe.com/global#BR|website=stripe.com|accessdate=10 October 2017}}</ref> | 1 |
| 20:22, 6 October 2017 | Funding Rounds for Spotify. Disclosed amounts..png (file) |  |
100 KB | Funding Rounds for Spotify. Disclosed amounts.<ref>{{cite web|title=Spotify|url=https://www.crunchbase.com/organization/spotify#/entity|website=crunchbase.com|accessdate=7 October 2017}}</ref> | 1 |
| 19:44, 6 October 2017 | Funding Rounds for Stripe. In US$ millions..png (file) |  |
116 KB | Funding Rounds for Stripe. In US$ millions.<ref>{{cite web|title=Stripe|url=https://www.crunchbase.com/organization/stripe#/entity|website=crunchbase.com|accessdate=7 October 2017}}</ref> | 1 |
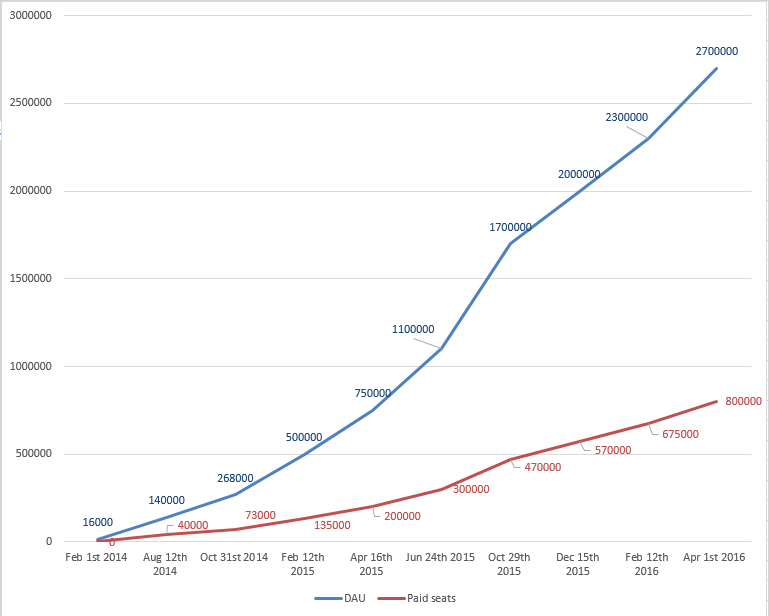
| 12:57, 3 October 2017 | Evolution of Slack’s daily active users (DAU) and paid seats.png (file) | _and_paid_seats.png) |
22 KB | Evolution of Slack’s daily active users (DAU) and paid seats.<ref>{{cite web|title=Slack’s growth is insane, with daily user count up 3.5X in a year|url=https://techcrunch.com/2016/04/01/rocketship-emoji/|website=techcrunch.com|accessdate=3 October... | 1 |
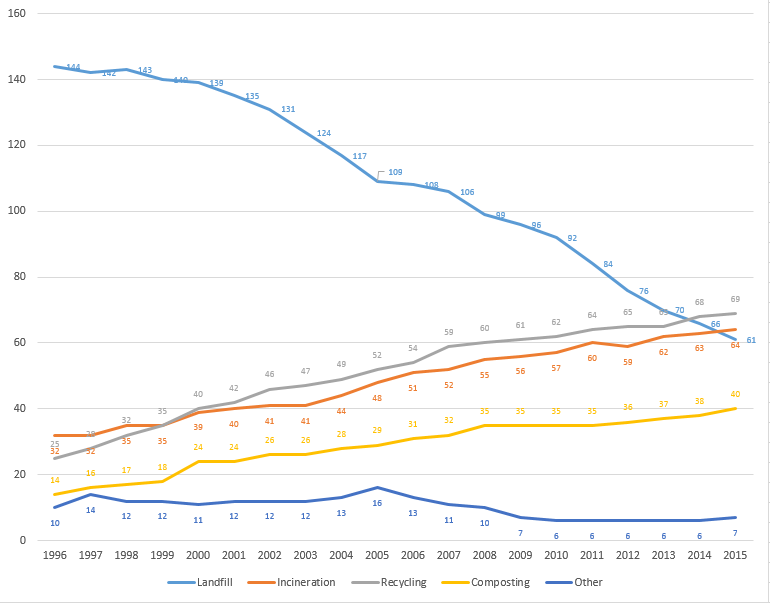
| 06:39, 26 September 2017 | Municipal waste landfilled, incinerated, recycled and composted in the European Union. In kg per capita..png (file) |  |
31 KB | 1 | |
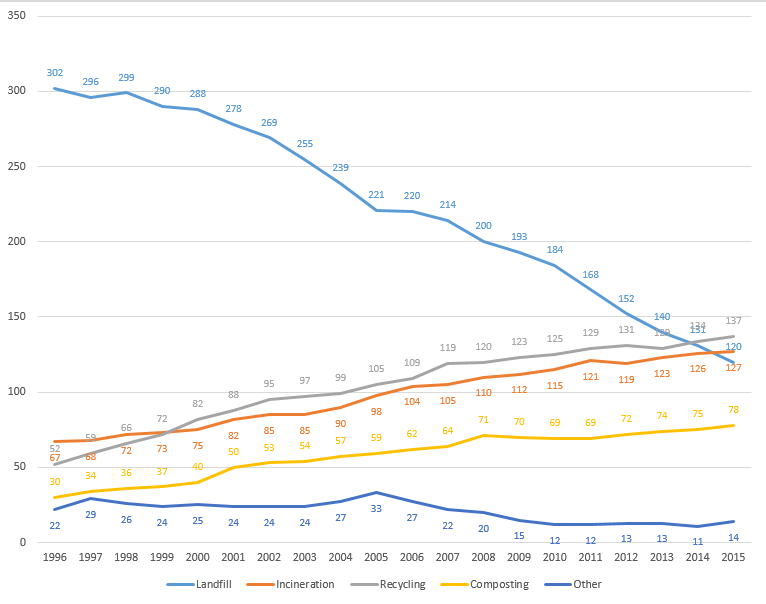
| 06:22, 26 September 2017 | Municipal waste landfilled, incinerated, recycled and composted in the European Union. In millions of tonnes..png (file) |  |
30 KB | Municipal waste landfilled, incinerated, recycled and composted in the European Union. In millions of tonnes. | 1 |
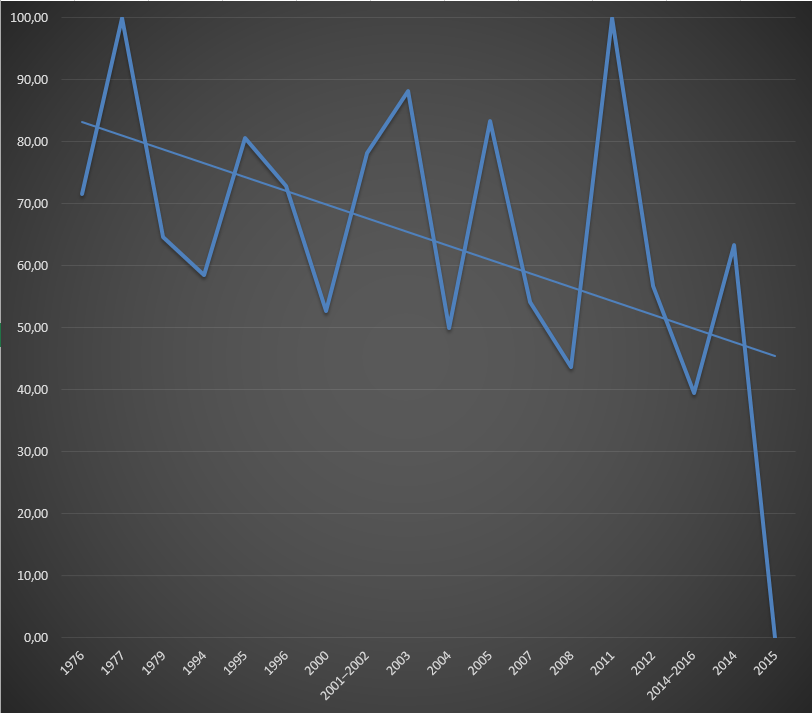
| 13:50, 15 July 2017 | Ebola death rate per year-period, with trend line included..png (file) |  |
174 KB | Ebola death rate per year-period, with trend line included.<ref>{{cite web|title=Ebola virus disease|url=http://www.who.int/mediacentre/factsheets/fs103/en/|website=who.int|accessdate=15 July 2017}}</ref> | 1 |
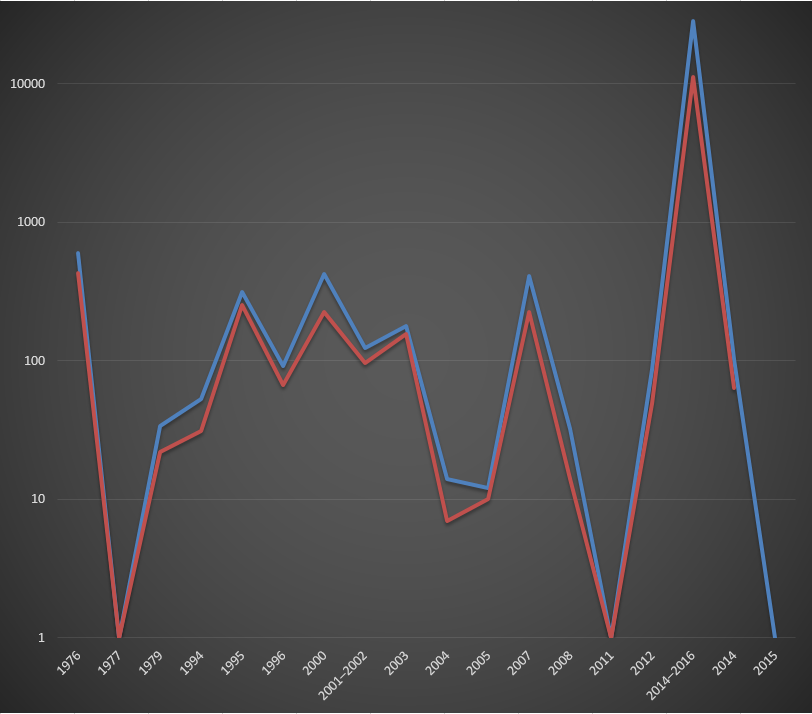
| 13:49, 15 July 2017 | Reported Ebola cases (blue) and deaths (red) per year-period. Logarithmic scale..png (file) | _and_deaths_(red)_per_year-period._Logarithmic_scale..png) |
124 KB | Reported Ebola cases (blue) and deaths (red) per year-period. Logarithmic scale.<ref>{{cite web|title=Ebola virus disease|url=http://www.who.int/mediacentre/factsheets/fs103/en/|website=who.int|accessdate=15 July 2017}}</ref> | 1 |
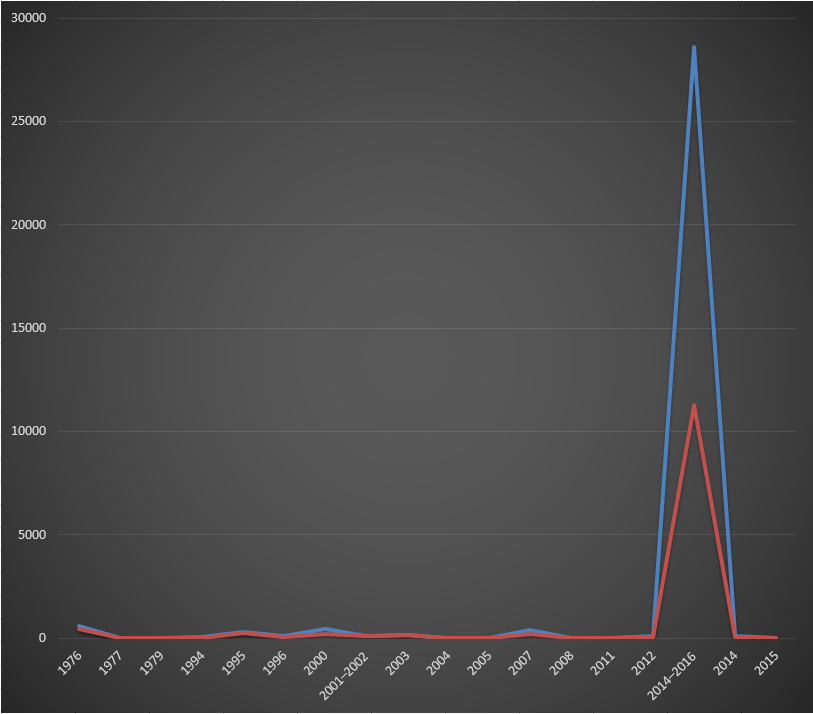
| 13:48, 15 July 2017 | Reported Ebola cases (blue) and deaths (red) per year-period..png (file) | _and_deaths_(red)_per_year-period..png) |
150 KB | Reported Ebola cases (blue) and deaths (red) per year/period.<ref>{{cite web|title=Ebola virus disease|url=http://www.who.int/mediacentre/factsheets/fs103/en/|website=who.int|accessdate=15 July 2017}}</ref> | 1 |
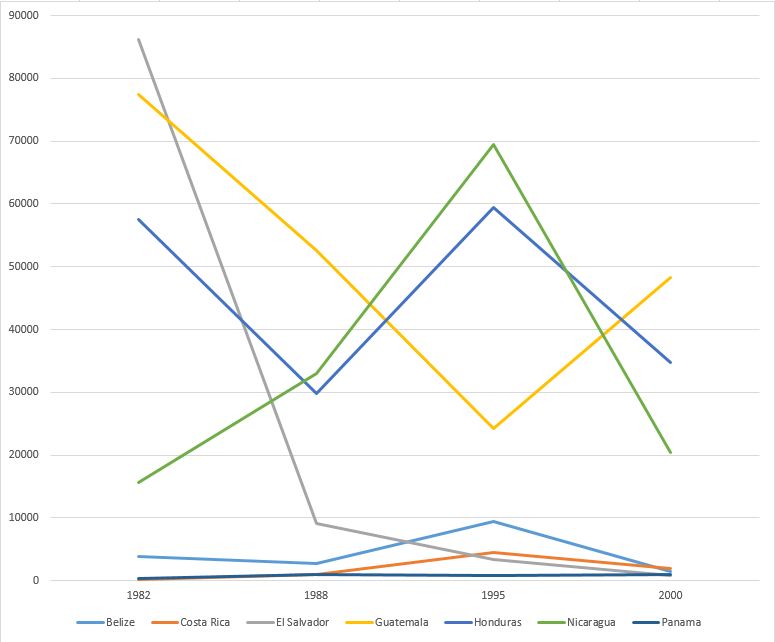
| 13:35, 11 July 2017 | Changes in the annual number of cases in the seven countries of Central America from 1982 to 2000.png (file) |  |
36 KB | Changes in the annual number of cases in the seven countries of Central America from 1982 to 2000.<ref>{{cite book|title=Biodiversity of Malaria in the World|url=https://books.google.com.ar/books?id=hSUfzyxZRuwC&pg=PA263&lpg=PA263&dq=%22in+1993%22+%22m... | 1 |
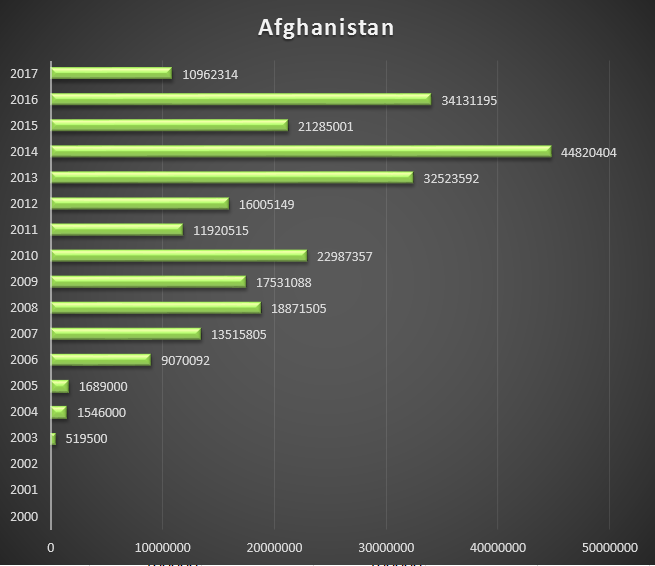
| 23:30, 2 June 2017 | Gavi total disbursment for Afghanistan, from 2000 to 2017. In US$..png (file) |  |
107 KB | Gavi total disbursment for Afghanistan, from 2000 to 2017. In US$. | 1 |
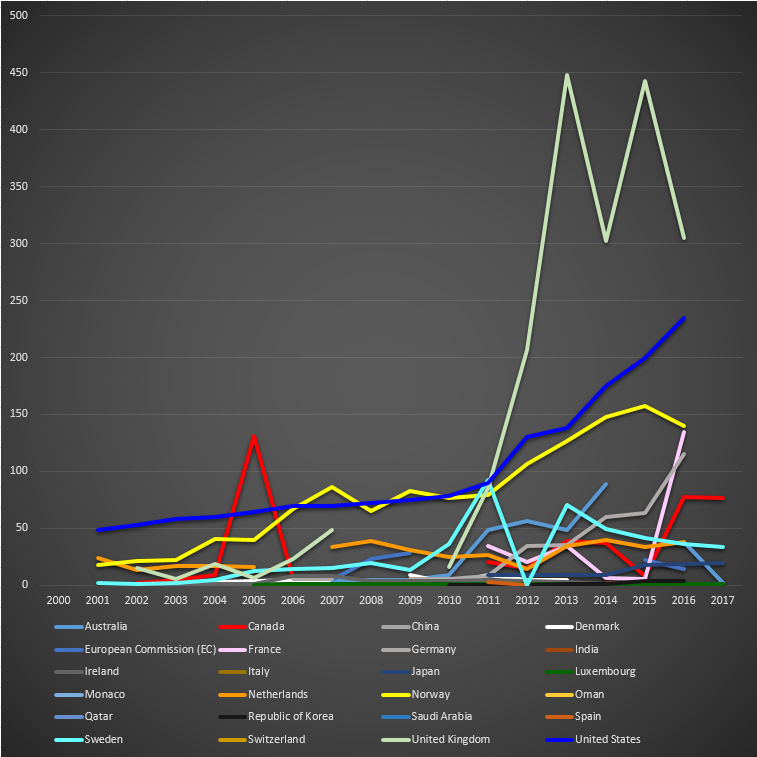
| 11:57, 2 June 2017 | Cash received by Gavi from countries, from its foundation year to 2017..png (file) |  |
190 KB | Cash received by Gavi from countries, from its foundation year to 2017.<ref>{{cite web|title=Cash receipts|url=http://www.gavi.org/funding/donor-contributions-pledges/cash-receipts/|website=gavi.org|accessdate=31 May 2017}}</ref> | 1 |
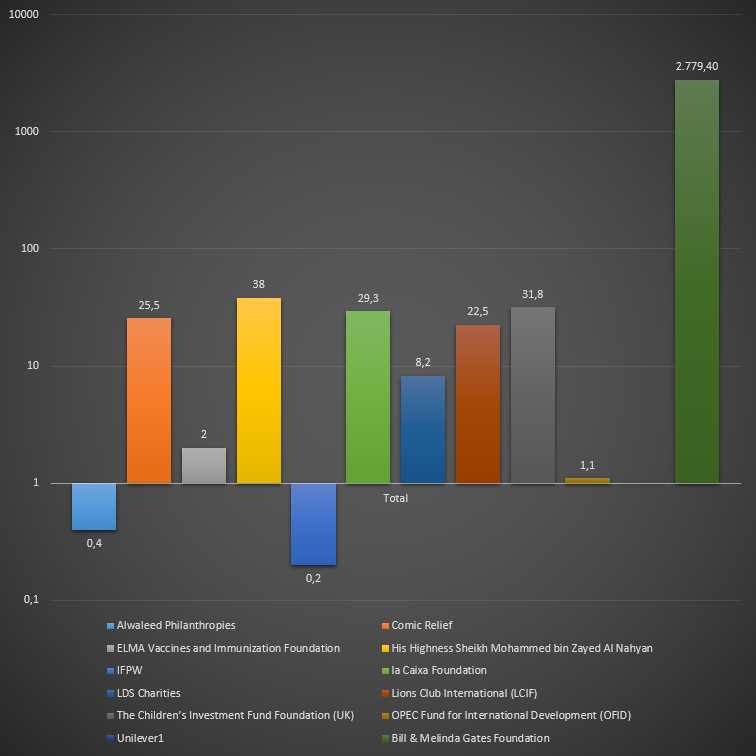
| 11:37, 2 June 2017 | Total cash received by Gavi from non–country donors, since its foundation to 2017..png (file) |  |
81 KB | 2 | |
| 11:33, 2 June 2017 | Total cash received by Gavi from countries, from its foundation to 2017..png (file) |  |
127 KB | 2 | |
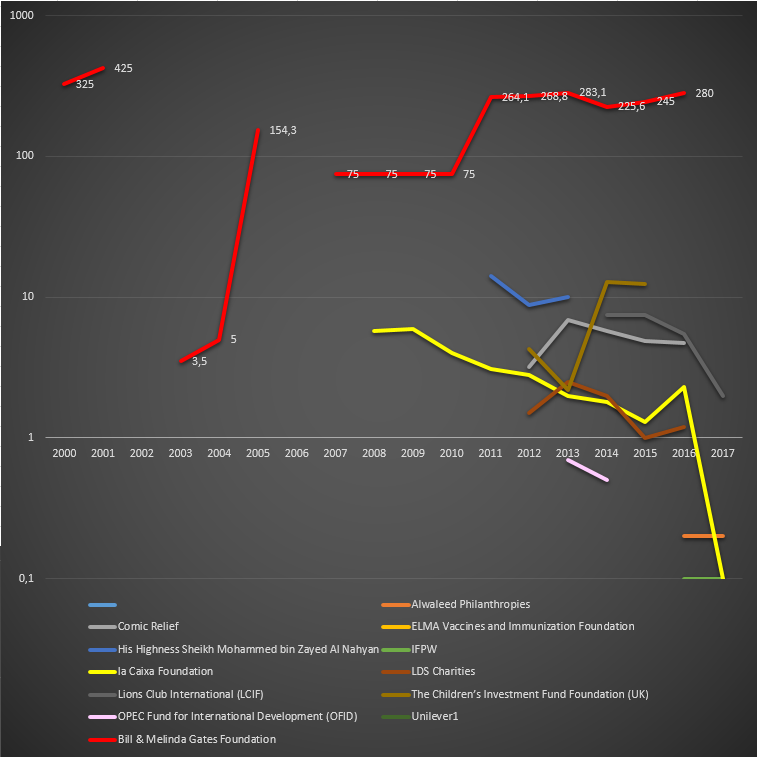
| 11:12, 2 June 2017 | Cash received by Gavi from non–country donors per year. In US$ millions. Detailed figures are displayed for The Bill & Melinda Gates Foundation. Logaritmic scale..png (file) |  |
118 KB | Cash received by Gavi from non–country donors per year. In US$ millions. Detailed figures are displayed for The Bill & Melinda Gates Foundation. Logaritmic scale.<ref>{{cite web|title=Cash receipts|url=http://www.gavi.org/funding/donor-contributions-... | 1 |
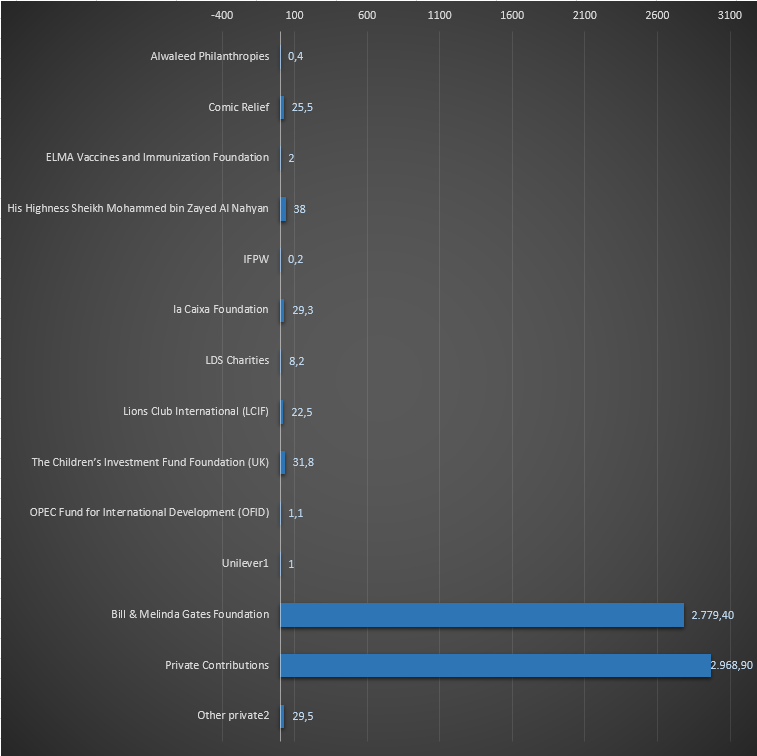
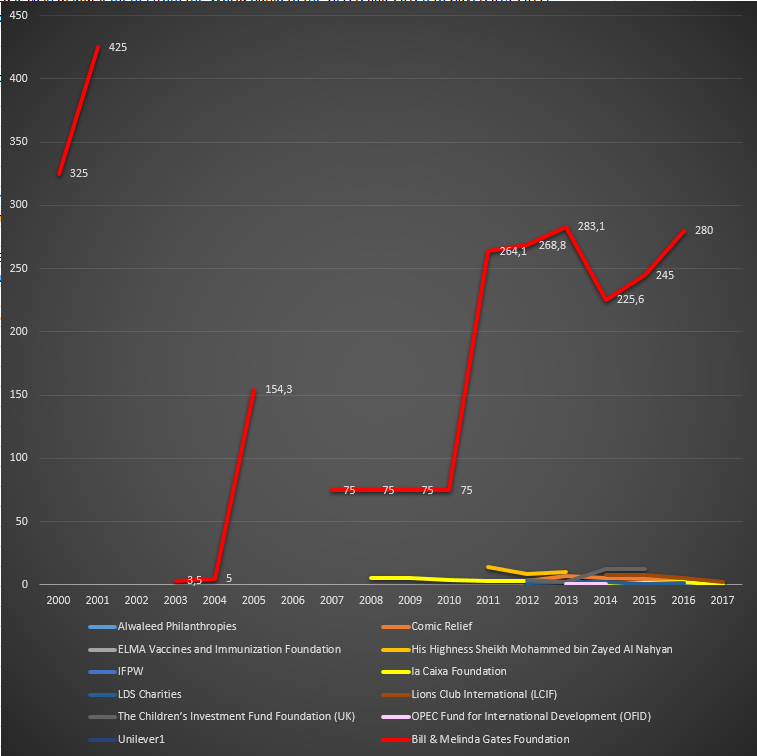
| 11:08, 2 June 2017 | Cash received by Gavi from non–country donors per year. In US$ millions. Detailed figures are displayed for The Bill & Melinda Gates Foundation..png (file) |  |
147 KB | Cash received by Gavi from non–country donors per year. In US$ millions. Detailed figures are displayed for The Bill & Melinda Gates Foundation.<ref>{{cite web|title=Cash receipts|url=http://www.gavi.org/funding/donor-contributions-pledges/cash-recei... | 1 |
| 10:47, 2 June 2017 | Cash received by Gavi from non–country donors. In US$ millions. Logaritmic scale..png (file) |  |
124 KB | Cash received by Gavi from non–country donors. In US$ millions. Logaritmic scale. | 1 |
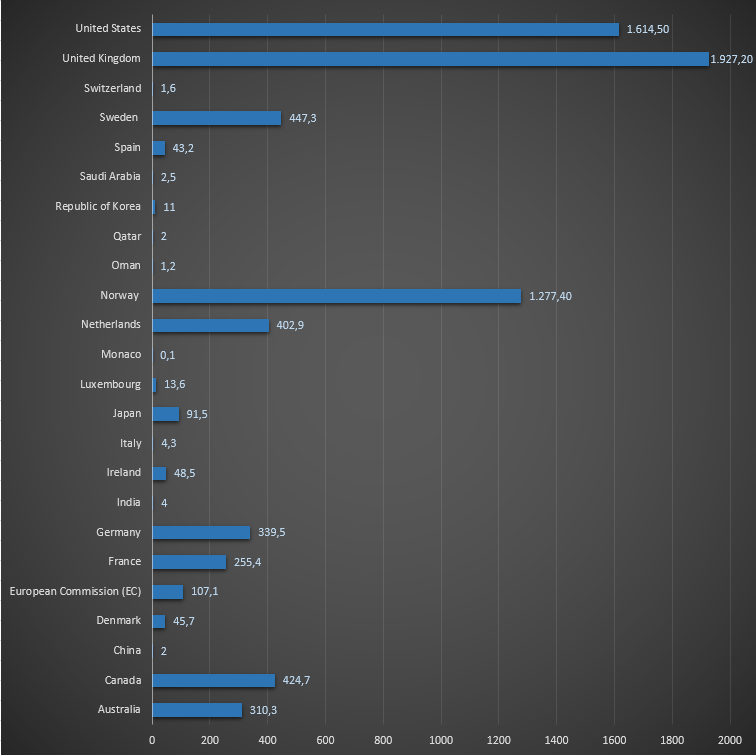
| 20:07, 31 May 2017 | Donor countries to GAVI throughout its history.png (file) |  |
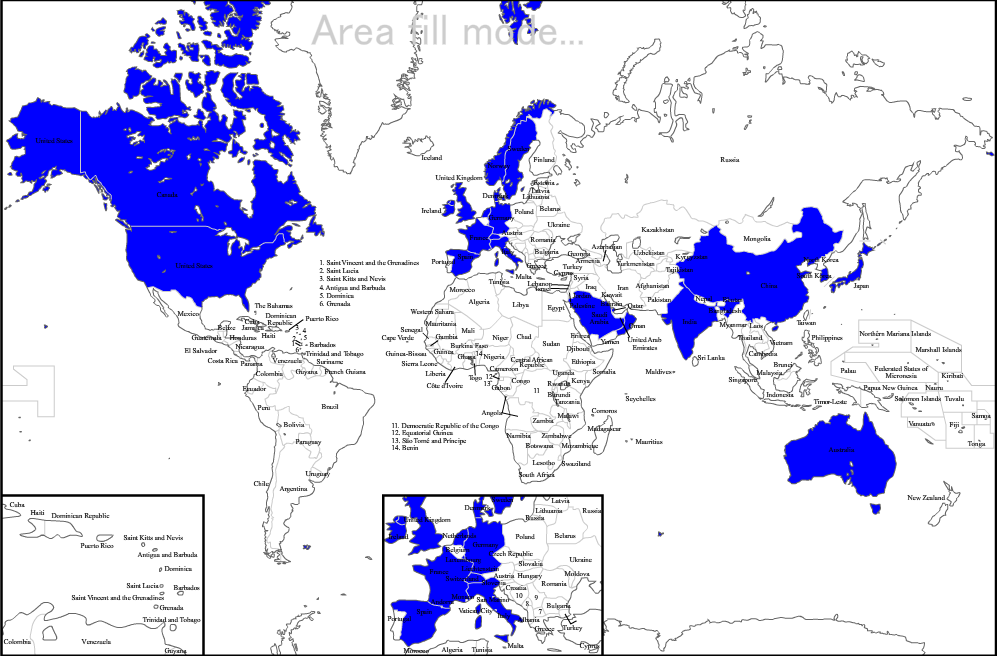
174 KB | Donor countries to GAVI throughout its history.<ref>{{cite web|title=Cash receipts|url=http://www.gavi.org/funding/donor-contributions-pledges/cash-receipts/|website=gavi.org|accessdate=31 May 2017}}</ref> | 1 |
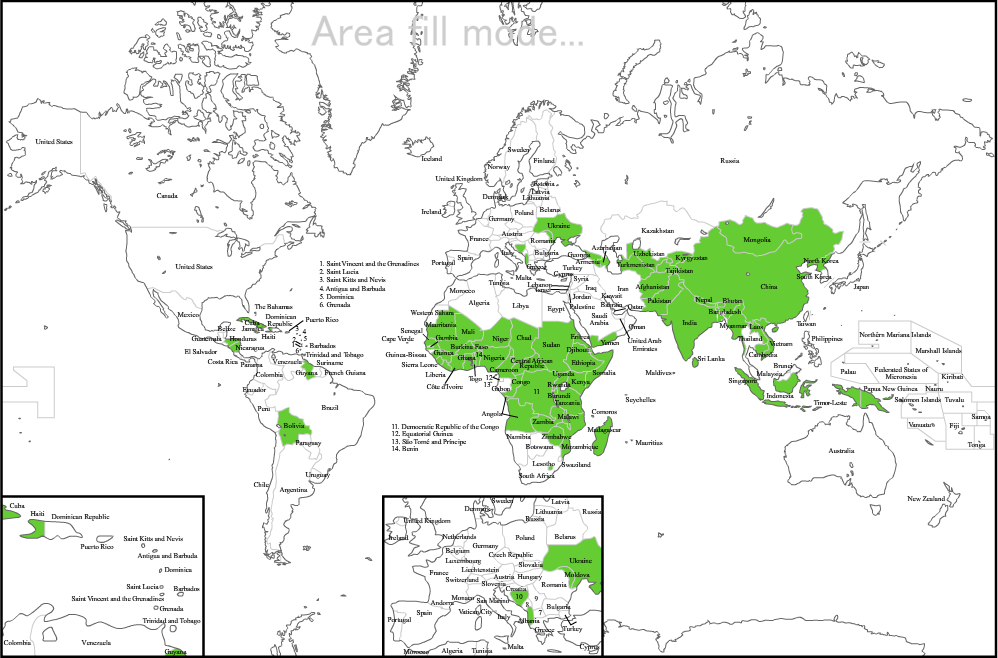
| 19:00, 31 May 2017 | Gavi world.png (file) |  |
224 KB | Banglashed was missing | 2 |
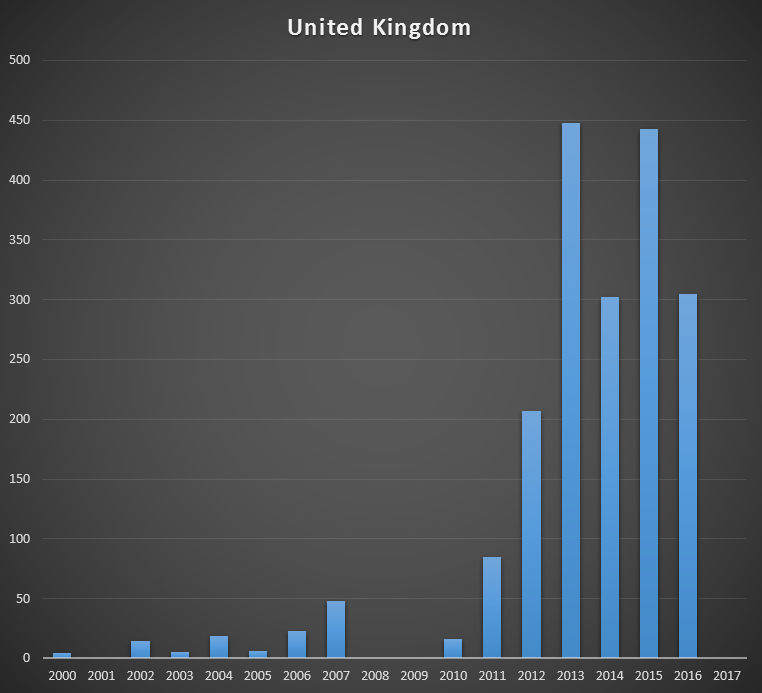
| 18:16, 31 May 2017 | Cash received by GAVI from the United Kingdom, per year, in US$ millions..png (file) |  |
133 KB | Cash received by GAVI from the United Kingdom, per year, in US$ millions.<ref>{{cite web|title=Cash receipts|url=http://www.gavi.org/funding/donor-contributions-pledges/cash-receipts/|website=gavi.org|accessdate=31 May 2017}}</ref> | 1 |
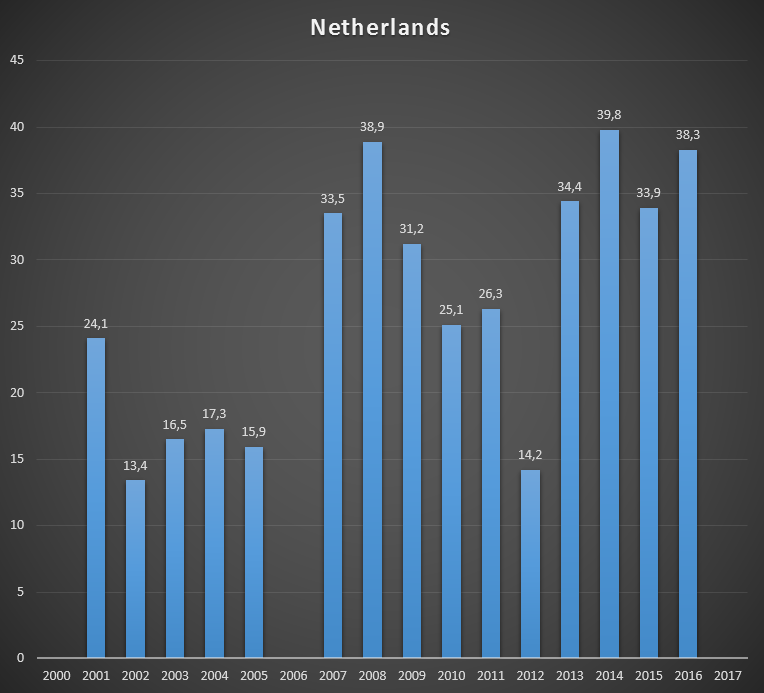
| 18:15, 31 May 2017 | Cash received by GAVI from The Netherlands, per year, in US$ millions..png (file) |  |
72 KB | Cash received by GAVI from The Netherlands, per year, in US$ millions.<ref>{{cite web|title=Cash receipts|url=http://www.gavi.org/funding/donor-contributions-pledges/cash-receipts/|website=gavi.org|accessdate=31 May 2017}}</ref> | 1 |
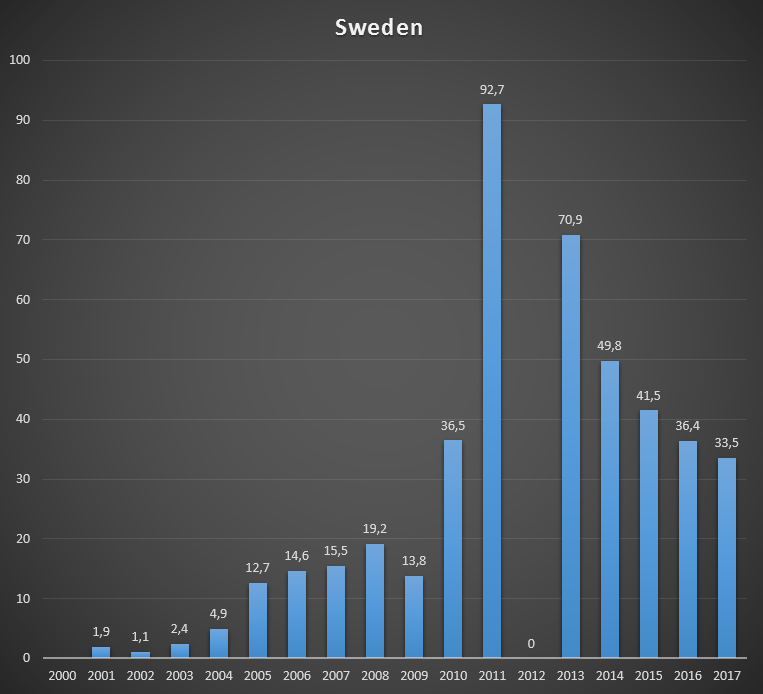
| 18:15, 31 May 2017 | Cash received by GAVI from Sweden, per year, in US$ millions..png (file) |  |
134 KB | Cash received by GAVI from Sweden, per year, in US$ millions.<ref>{{cite web|title=Cash receipts|url=http://www.gavi.org/funding/donor-contributions-pledges/cash-receipts/|website=gavi.org|accessdate=31 May 2017}}</ref> | 1 |
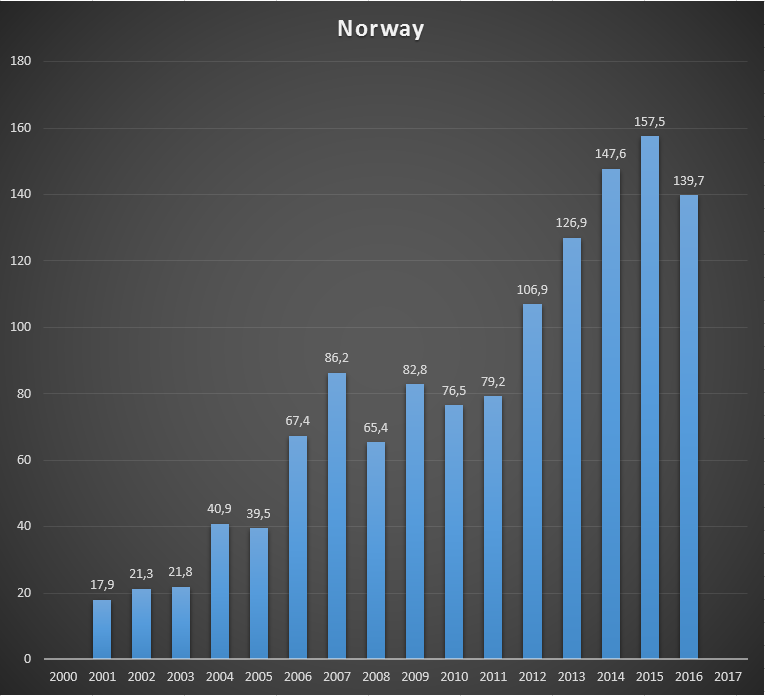
| 18:14, 31 May 2017 | Cash received by GAVI from Norway, per year, in US$ millions..png (file) |  |
153 KB | Cash received by GAVI from Norway, per year, in US$ millions.<ref>{{cite web|title=Cash receipts|url=http://www.gavi.org/funding/donor-contributions-pledges/cash-receipts/|website=gavi.org|accessdate=31 May 2017}}</ref> | 1 |
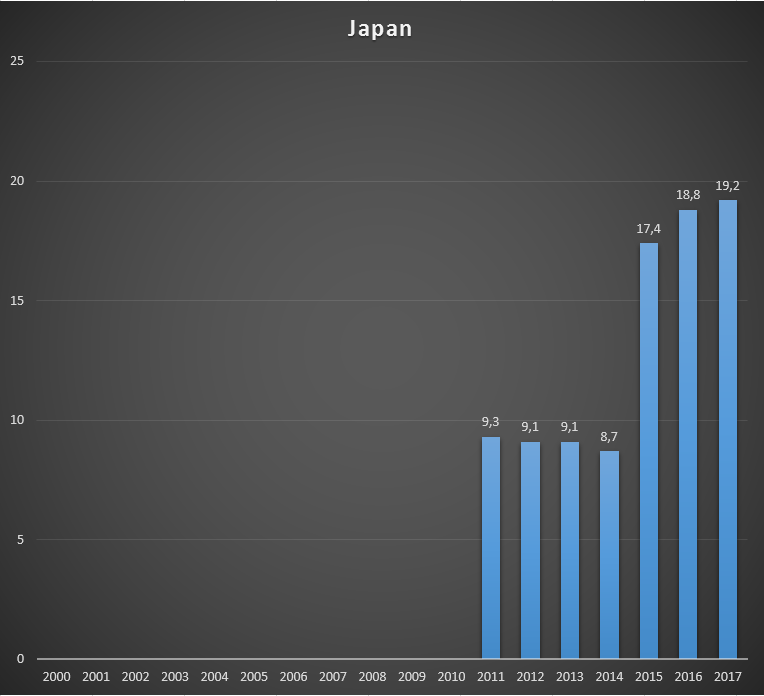
| 18:13, 31 May 2017 | Cash received by GAVI from Japan, per year, in US$ millions..png (file) |  |
125 KB | Cash received by GAVI from Japan, per year, in US$ millions.<ref>{{cite web|title=Cash receipts|url=http://www.gavi.org/funding/donor-contributions-pledges/cash-receipts/|website=gavi.org|accessdate=31 May 2017}}</ref> | 1 |
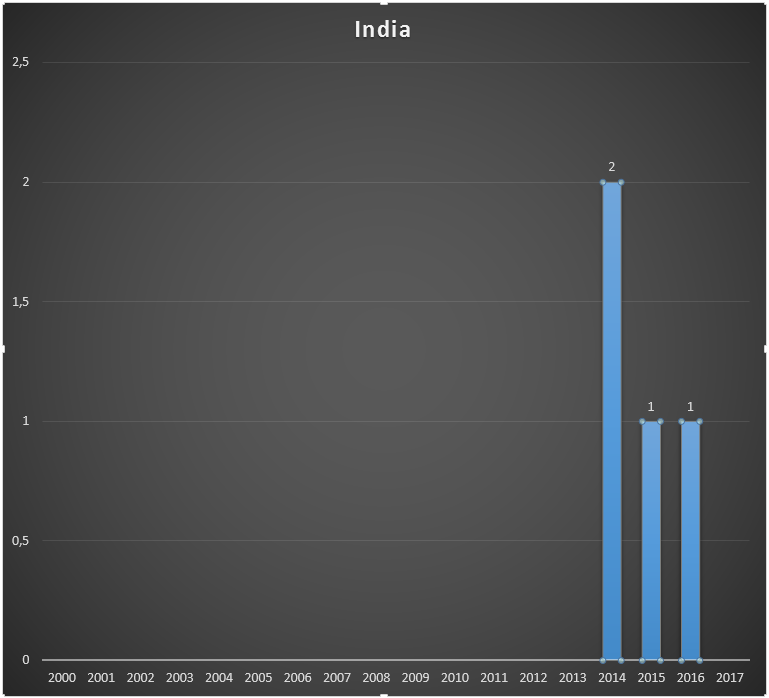
| 18:13, 31 May 2017 | Cash received by GAVI from India, per year, in US$ millions..png (file) |  |
63 KB | Cash received by GAVI from India, per year, in US$ millions.<ref>{{cite web|title=Cash receipts|url=http://www.gavi.org/funding/donor-contributions-pledges/cash-receipts/|website=gavi.org|accessdate=31 May 2017}}</ref> | 1 |
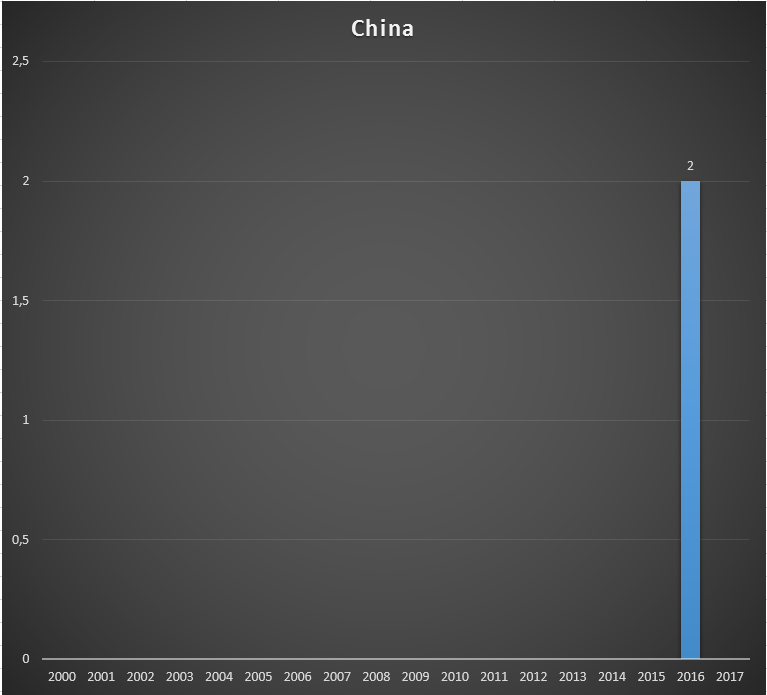
| 18:12, 31 May 2017 | Cash received by GAVI from China, per year, in US$ millions..png (file) |  |
109 KB | Cash received by GAVI from China, per year, in US$ millions.<ref>{{cite web|title=Cash receipts|url=http://www.gavi.org/funding/donor-contributions-pledges/cash-receipts/|website=gavi.org|accessdate=31 May 2017}}</ref> | 1 |
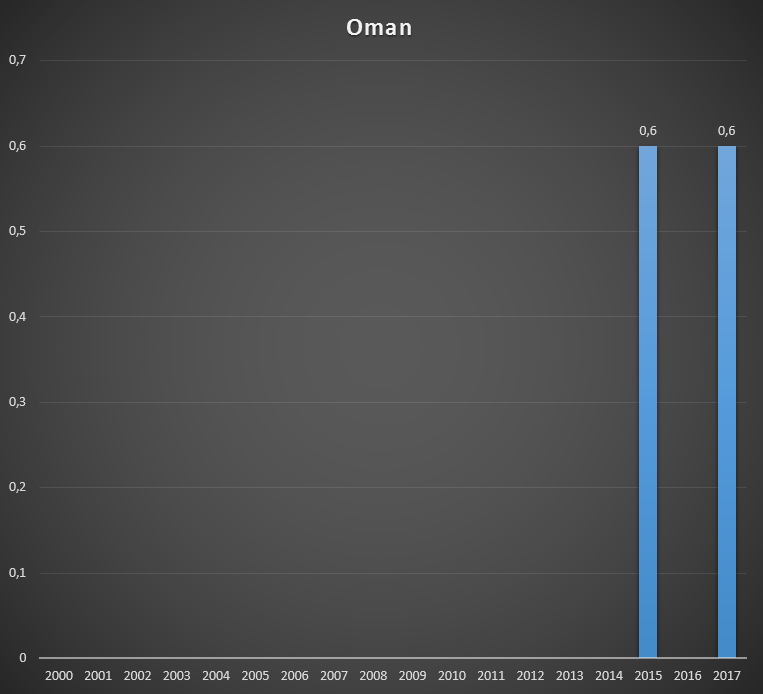
| 18:11, 31 May 2017 | Cash received by GAVI from Oman, per year, in US$ millions..png (file) |  |
61 KB | Cash received by GAVI from Oman, per year, in US$ millions.<ref>{{cite web|title=Cash receipts|url=http://www.gavi.org/funding/donor-contributions-pledges/cash-receipts/|website=gavi.org|accessdate=31 May 2017}}</ref> | 1 |
First page |
Previous page |
Next page |
Last page |