File:Bitcoin hash rate logarithmic.png
From Timelines
Size of this preview: 800 × 380 pixels. Other resolutions: 320 × 152 pixels | 1,484 × 705 pixels.
Original file (1,484 × 705 pixels, file size: 47 KB, MIME type: image/png)
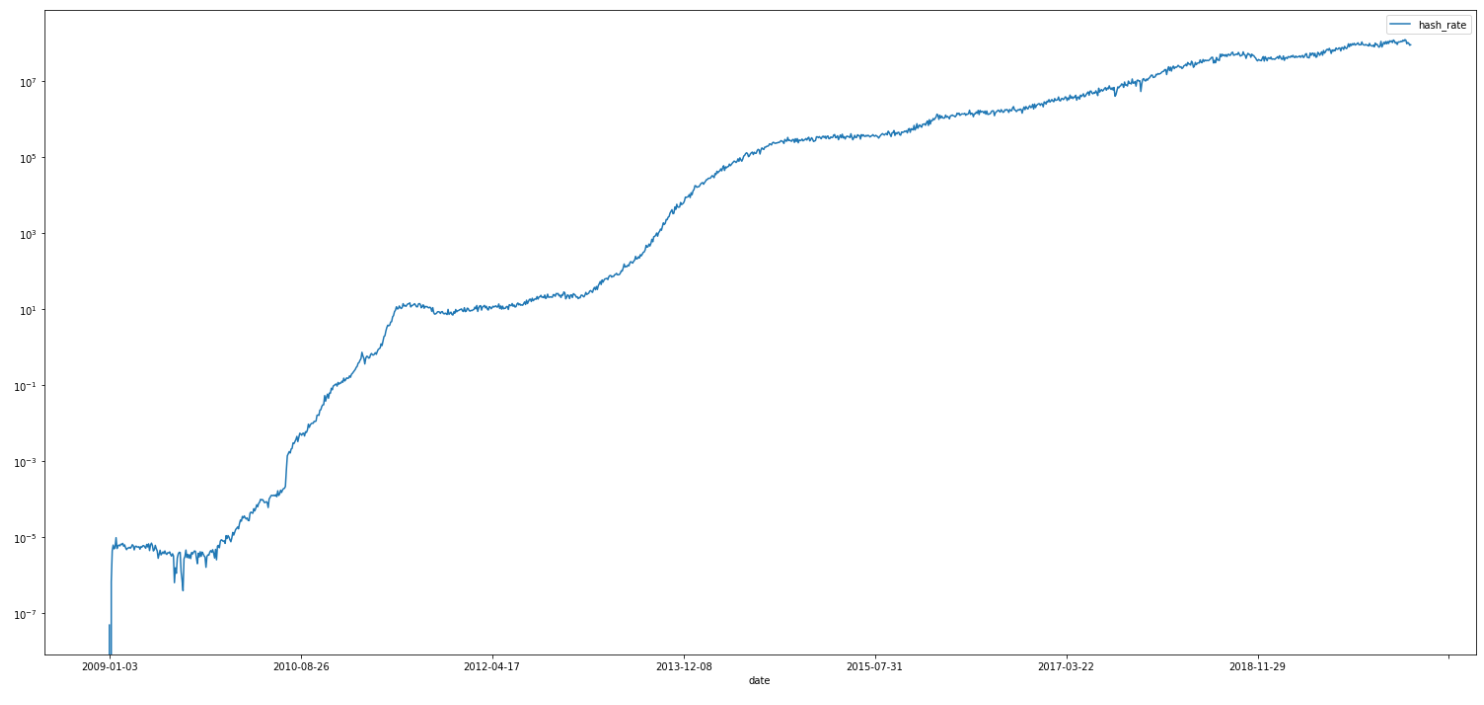
The image shows the estimated number of tera hashes per second (trillions of hashes per second) the Bitcoin network is performing. The graph is displayed in logarithmic scale.[1]
- ↑ "Blockchain Charts". blockchain.com. Retrieved 25 March 2020.
File history
Click on a date/time to view the file as it appeared at that time.
| Date/Time | Thumbnail | Dimensions | User | Comment | |
|---|---|---|---|---|---|
| current | 09:09, 25 March 2020 | | 1,484 × 705 (47 KB) | Sebastian (talk | contribs) | The image shows the estimated number of tera hashes per second (trillions of hashes per second) the Bitcoin network is performing. The graph is displayed in logarithmic scale.<ref>{{cite web |title=Blockchain Charts |url=https://www.blockchain.com/en/c... |
- You cannot overwrite this file.
File usage
There are no pages that link to this file.