File:Eth price log.png
From Timelines
Size of this preview: 800 × 376 pixels. Other resolutions: 320 × 150 pixels | 1,238 × 582 pixels.
Original file (1,238 × 582 pixels, file size: 65 KB, MIME type: image/png)
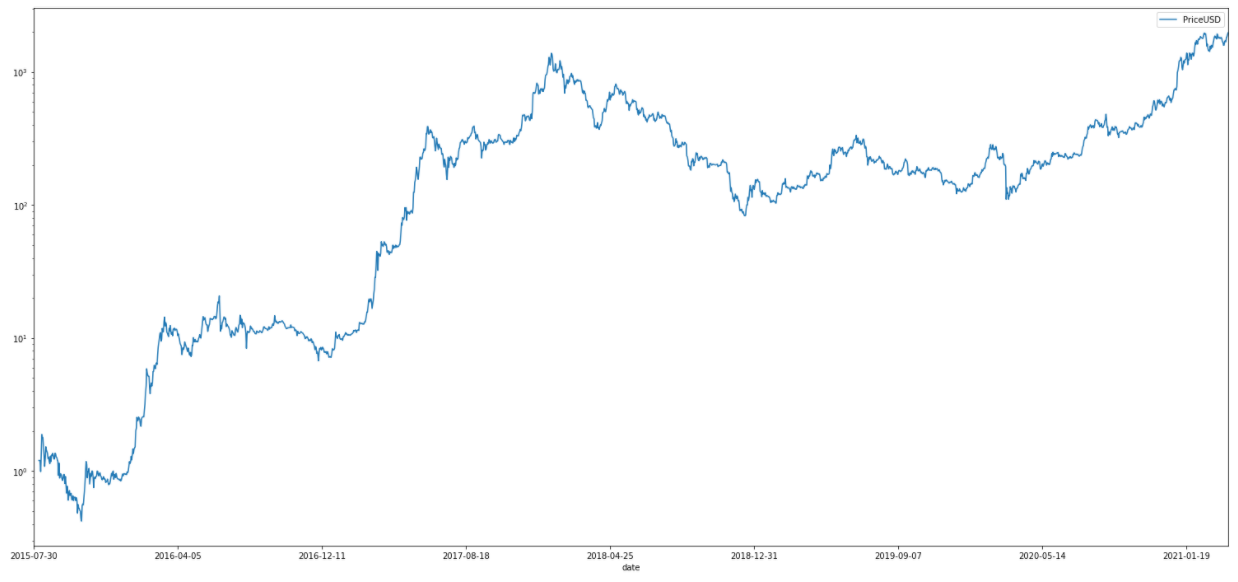
The chart shows the Ethereum price evolution in USD, in logarithmic scale.[1]
- ↑ "DATA FILE DOWNLOADS". coinmetrics.io.
File history
Click on a date/time to view the file as it appeared at that time.
| Date/Time | Thumbnail | Dimensions | User | Comment | |
|---|---|---|---|---|---|
| current | 17:44, 2 April 2021 | | 1,238 × 582 (65 KB) | Sebastian (talk | contribs) | The chart shows the Ethereum price evolution in USD, in logarithmic scale.<ref>{{cite web |title=DATA FILE DOWNLOADS |url=https://coinmetrics.io/community-network-data/ |website=coinmetrics.io}}</ref> |
- You cannot overwrite this file.
File usage
The following page links to this file: