File:Water desalination gt.png
From Timelines
Size of this preview: 800 × 403 pixels. Other resolutions: 320 × 161 pixels | 1,196 × 603 pixels.
Original file (1,196 × 603 pixels, file size: 138 KB, MIME type: image/png)
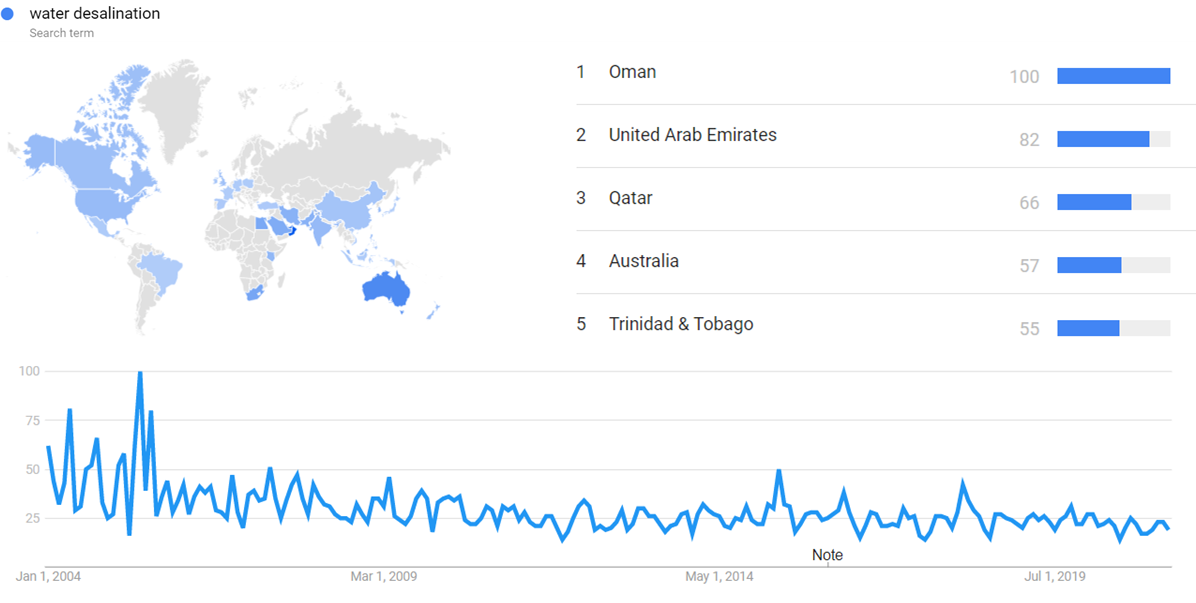
The chart shows Google Trends data for Water desalination (Search term), from January 2004 to April 2021, when the screenshot was taken. Interest is also ranked by country and displayed on world map.[1]
- ↑ "Water desalination". Google Trends. Retrieved 18 April 2021.
File history
Click on a date/time to view the file as it appeared at that time.
| Date/Time | Thumbnail | Dimensions | User | Comment | |
|---|---|---|---|---|---|
| current | 06:27, 18 April 2021 | | 1,196 × 603 (138 KB) | Sebastian (talk | contribs) | The chart shows {{w|Google Trends}} data for Water desalination (Search term), from January 2004 to April 2021, when the screenshot was taken. Interest is also ranked by country and displayed on world map.<ref>{{cite web |title=Water desalination |url=... |
- You cannot overwrite this file.
File usage
There are no pages that link to this file.