Difference between revisions of "Global health visual data repository"
From Timelines
| Line 27: | Line 27: | ||
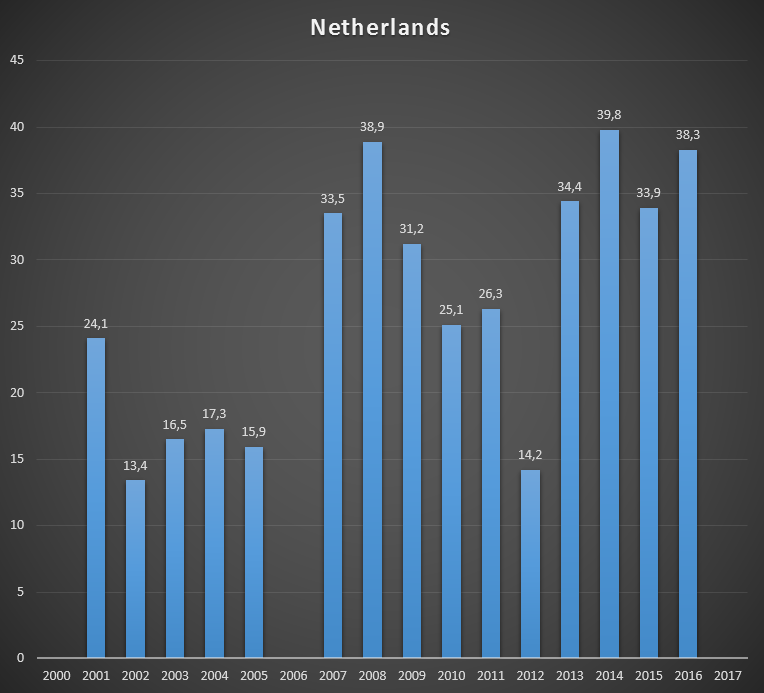
File:Cash received by GAVI from The Netherlands, per year, in US$ millions..png|Cash received by GAVI from the Netherlands, per year, in US$ millions. | File:Cash received by GAVI from The Netherlands, per year, in US$ millions..png|Cash received by GAVI from the Netherlands, per year, in US$ millions. | ||
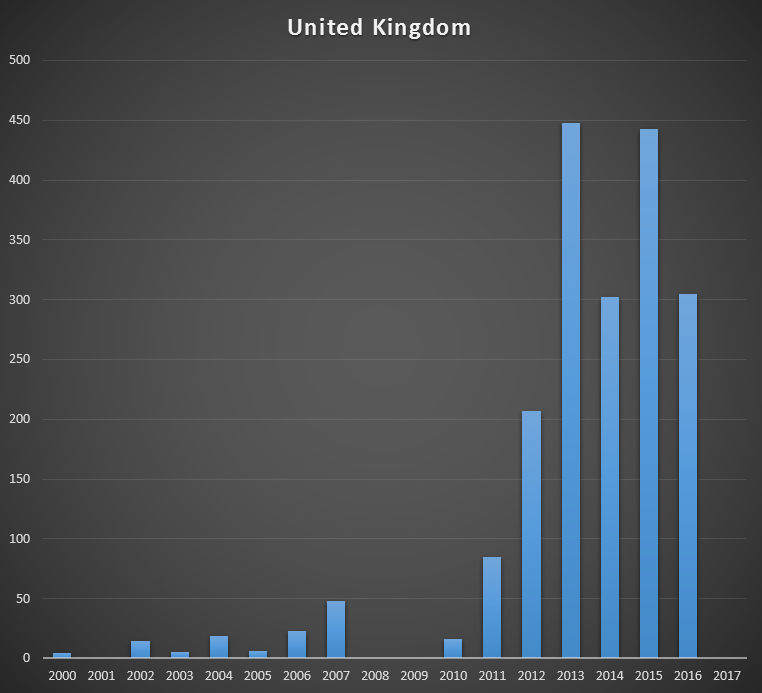
File:Cash received by GAVI from the United Kingdom, per year, in US$ millions..png|Cash received by GAVI from the United Kingdom, per year, in US$ millions. | File:Cash received by GAVI from the United Kingdom, per year, in US$ millions..png|Cash received by GAVI from the United Kingdom, per year, in US$ millions. | ||
| + | </gallery> | ||
| + | <gallery align="center" perrow="2" widths="550" heights="550" mode="nolines"> | ||
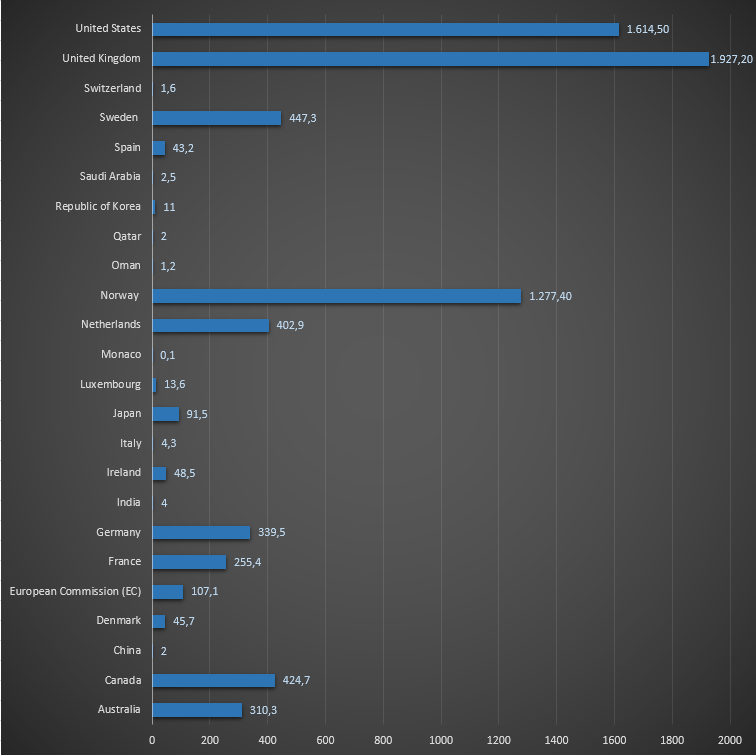
| + | File:Total cash received by Gavi from countries, from its foundation to 2017..png|thumb|center|600px|Total cash received by Gavi from countries, from its foundation to 2017. In millions of US$. | ||
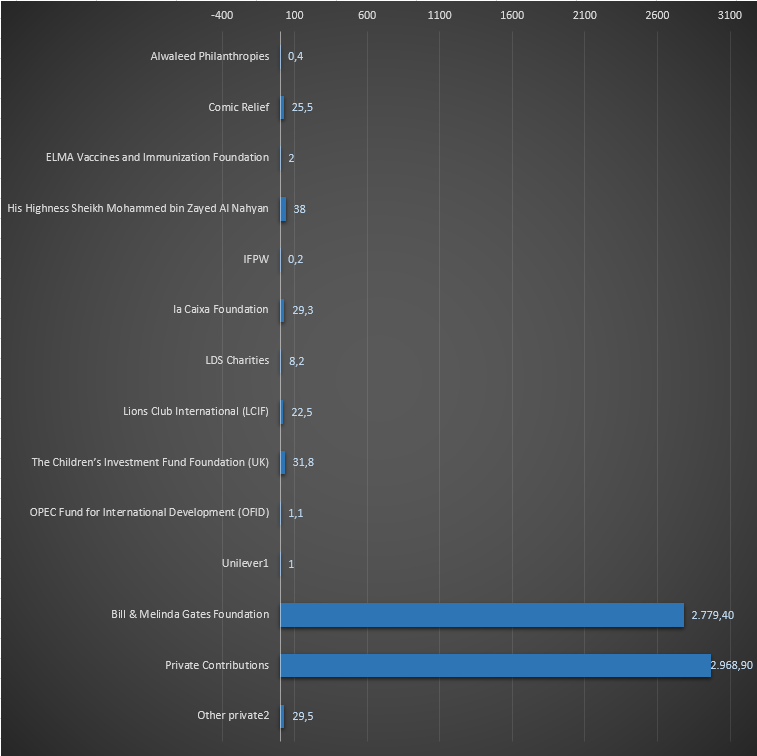
| + | File:Total cash received by Gavi from non–country donors, since its foundation to 2017..png|thumb|center|600px|Total cash received by Gavi from non–country donors, since its foundation to 2017. In millions of US$. | ||
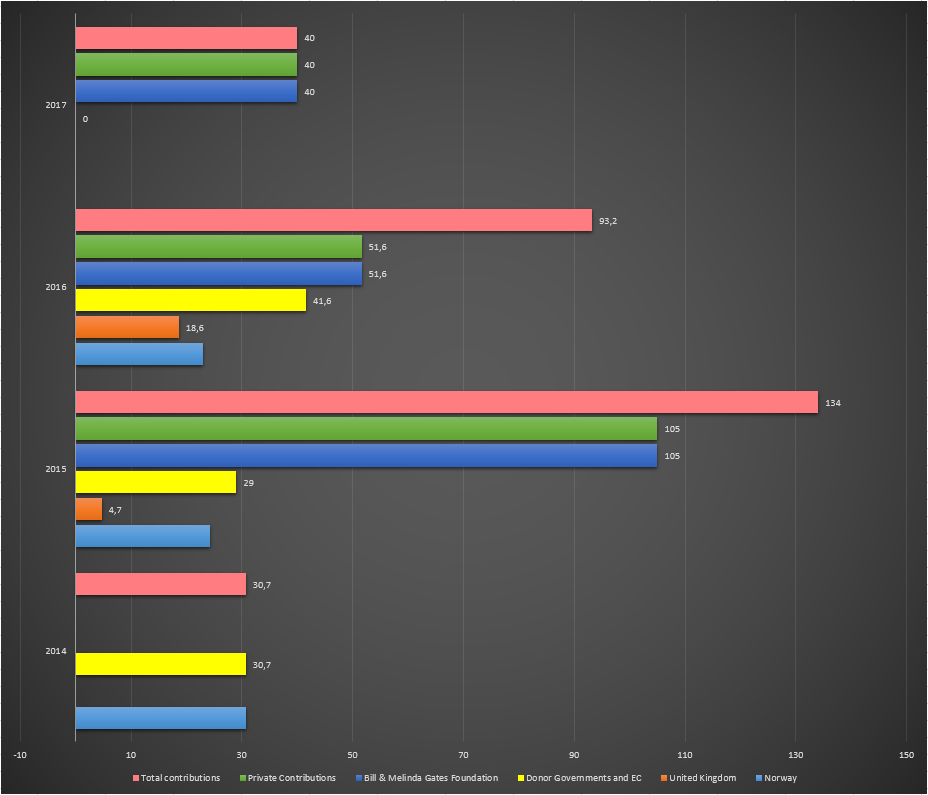
| + | File:Cash Received by Gavi (in support of Gavi for its role supporting the Polio eradication and endgame strategy and plan 2013-2018).png|thumb|center|600px|Cash Received by Gavi (in support of Gavi for its role supporting the Polio eradication and endgame strategy and plan 2013-2018). The Bill & Melinda Gates Foundation makes the total of private contributions. In millions of US$. | ||
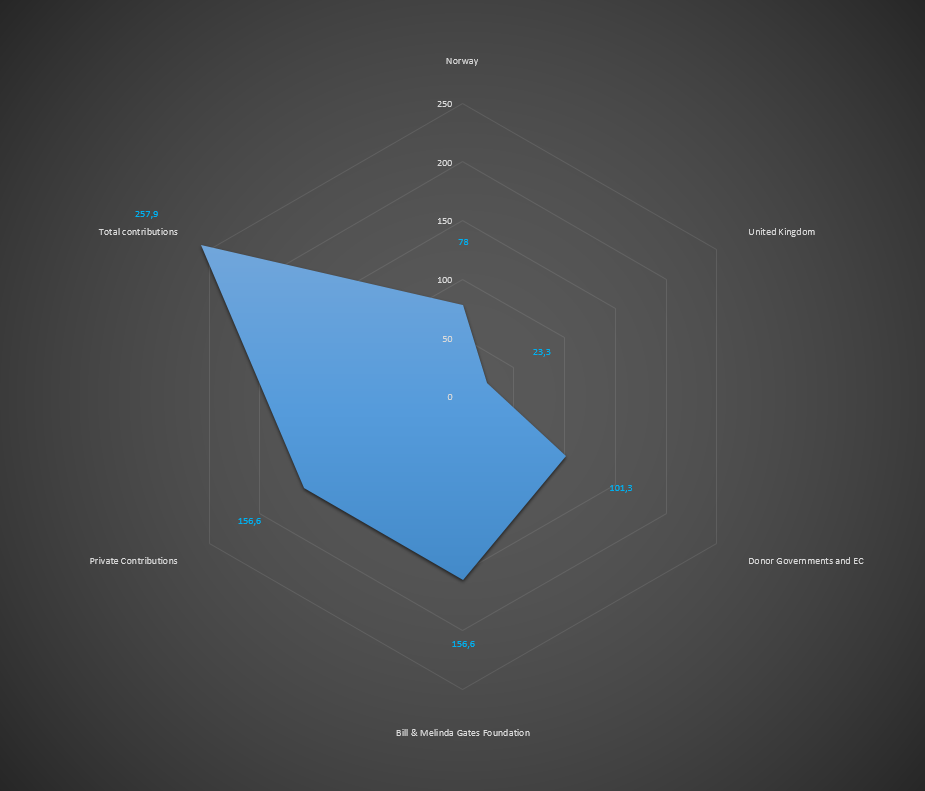
| + | File:Cash Received by Gavi (in support of Gavi for its role supporting the Polio eradication and endgame strategy and plan 2013-2018). Total. In US$ millions..png|thumb|center|600px|Cash Received by Gavi (in support of Gavi for its role supporting the Polio eradication and endgame strategy and plan 2013-2018). Total, in US$ millions. | ||
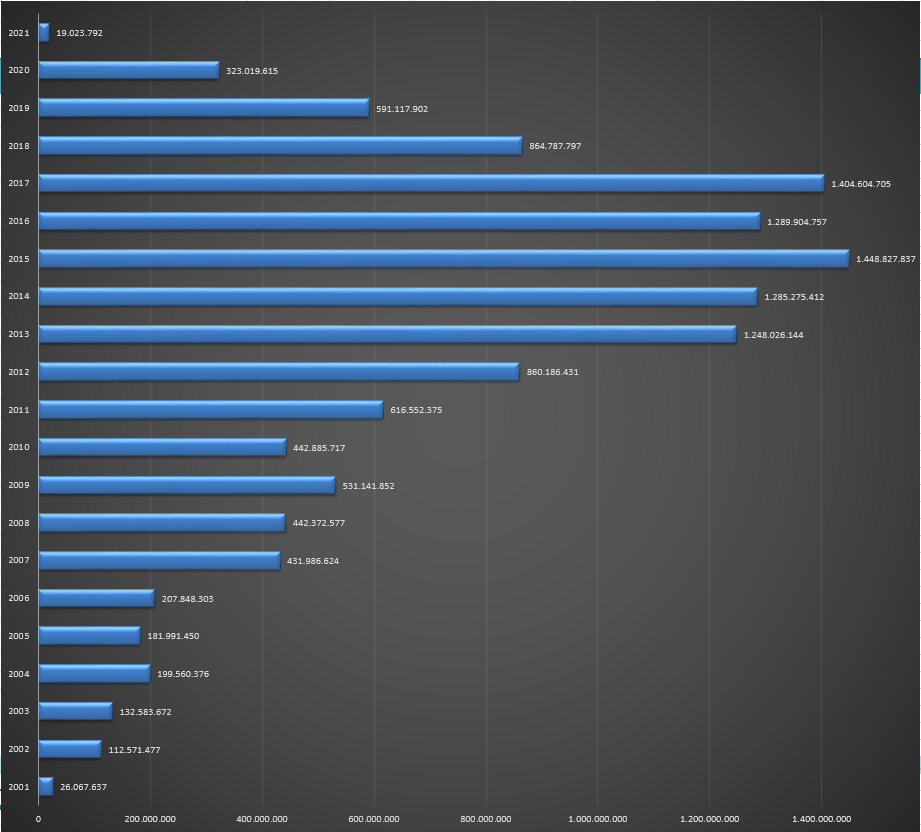
| + | File:Country programs total commitments per year. In US$..png|thumb|center|600px|Country programs total commitments per year. In US$. | ||
</gallery> | </gallery> | ||
| + | {{clear}} | ||
Revision as of 10:05, 1 June 2017
This page is meant to host visual data such as graphs and maps on the topic of global health that, for some reason, do not fit in the current timelines.
