Gallery of new files
Jump to navigation
Jump to search
This special page shows the last uploaded files.
-
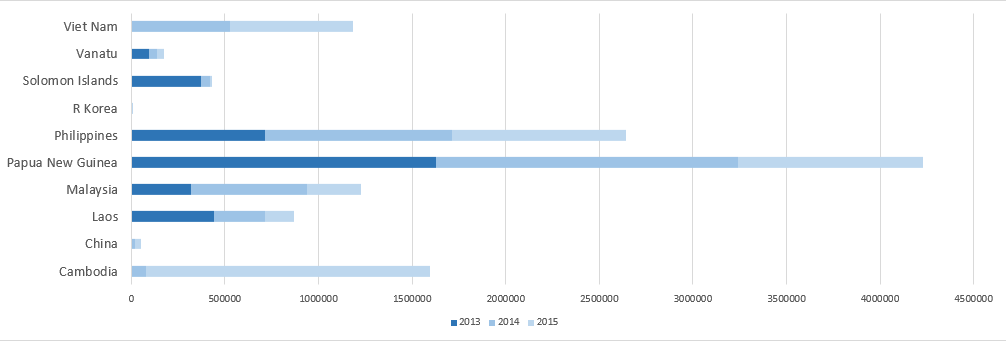 Mosquito net distribution in countries belonging to Western Pacific WHO region. Period 2013-2015. Cumulative.png Sebastian
20:04, 14 April 2017
1,006 × 341; 14 KB
-
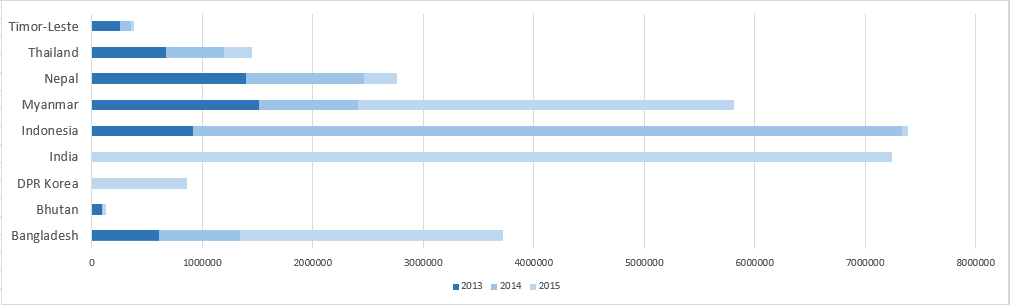 Mosquito net distribution in countries belonging to South East Asia WHO region. Period 2013-2015. Cumulative.png Sebastian
20:01, 14 April 2017
1,010 × 305; 11 KB
-
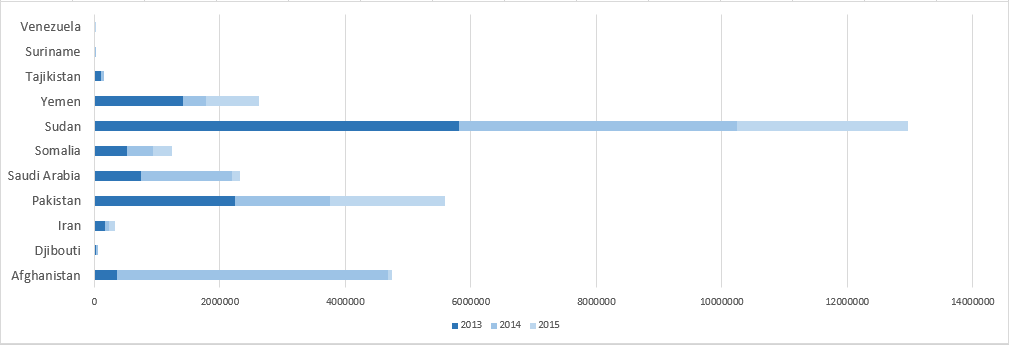 Mosquito net distribution in countries belonging to Americas, European and Eastern Mediterranean WHO regions. Period 2013-2015. Cumulative.png Sebastian
19:55, 14 April 2017
1,009 × 345; 12 KB
-
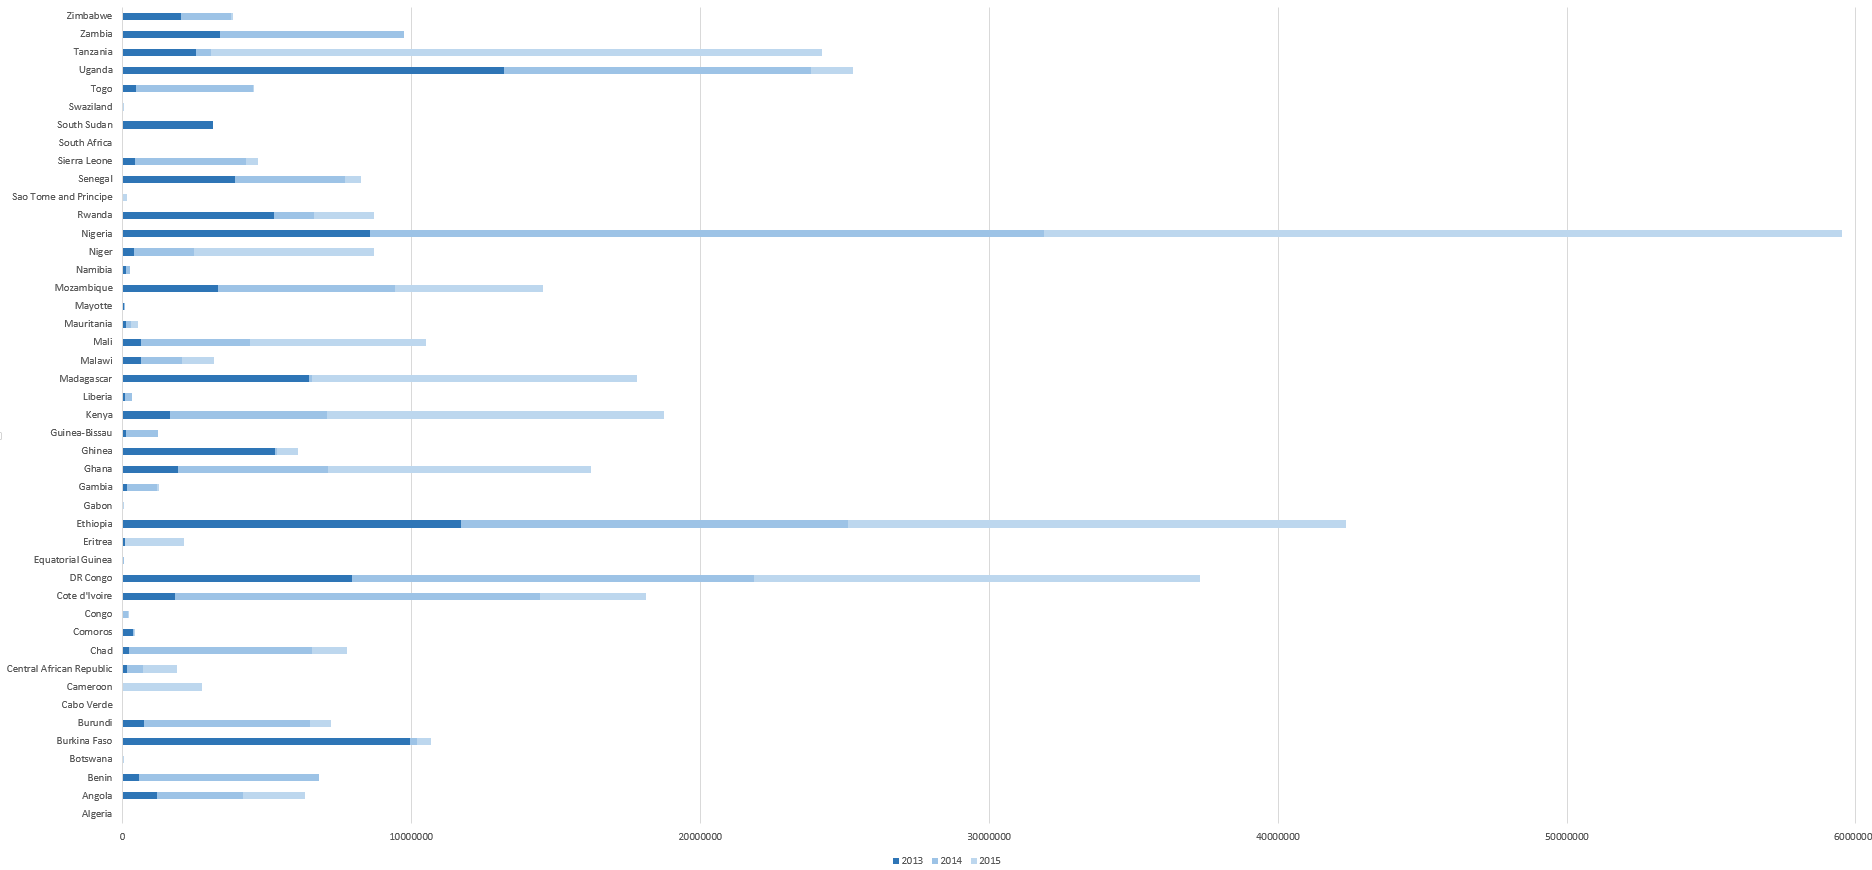 Mosquito net distribution in countries belonging to African WHO region. Period 2013-2015. Cumulative.png Sebastian
19:53, 14 April 2017
1,872 × 870; 35 KB
-
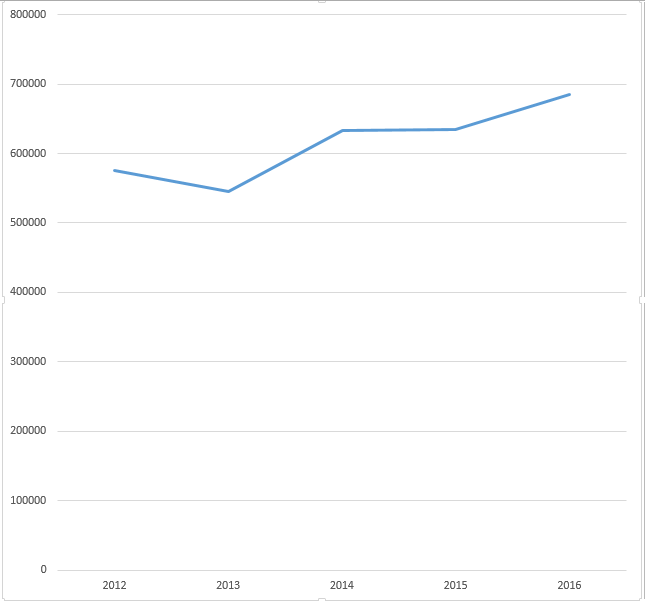
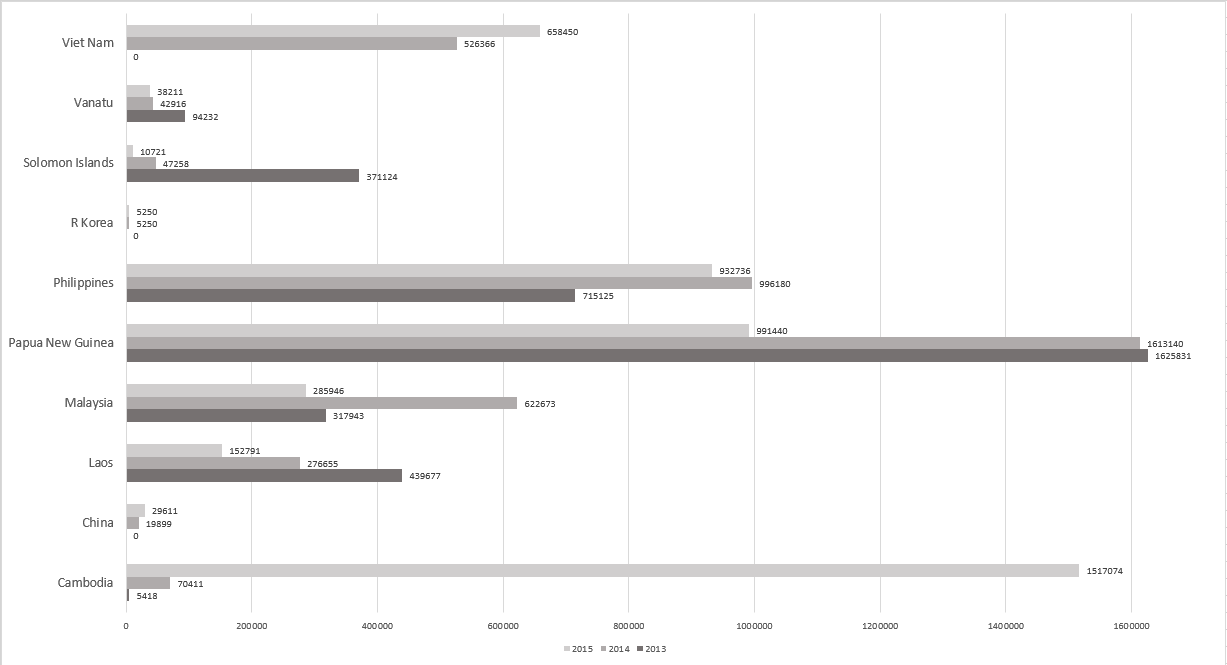 Mosquito net distribution in countries from Western Pacific WHO region. Period 2013-2015.png Sebastian
19:44, 14 April 2017
1,227 × 665; 26 KB
-
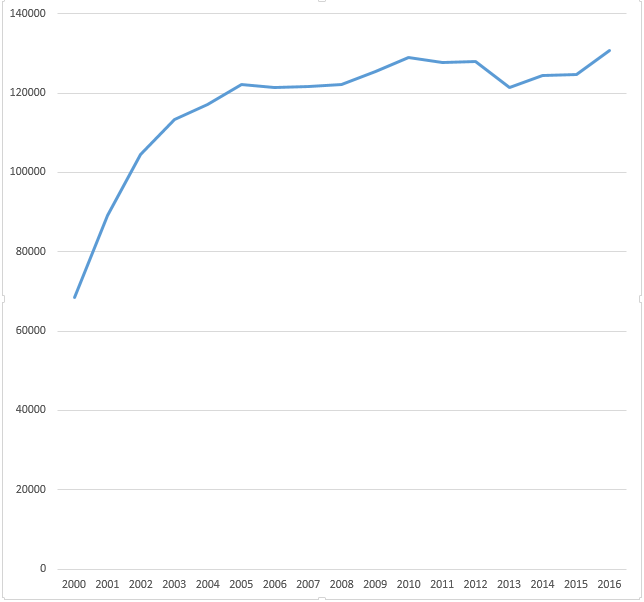
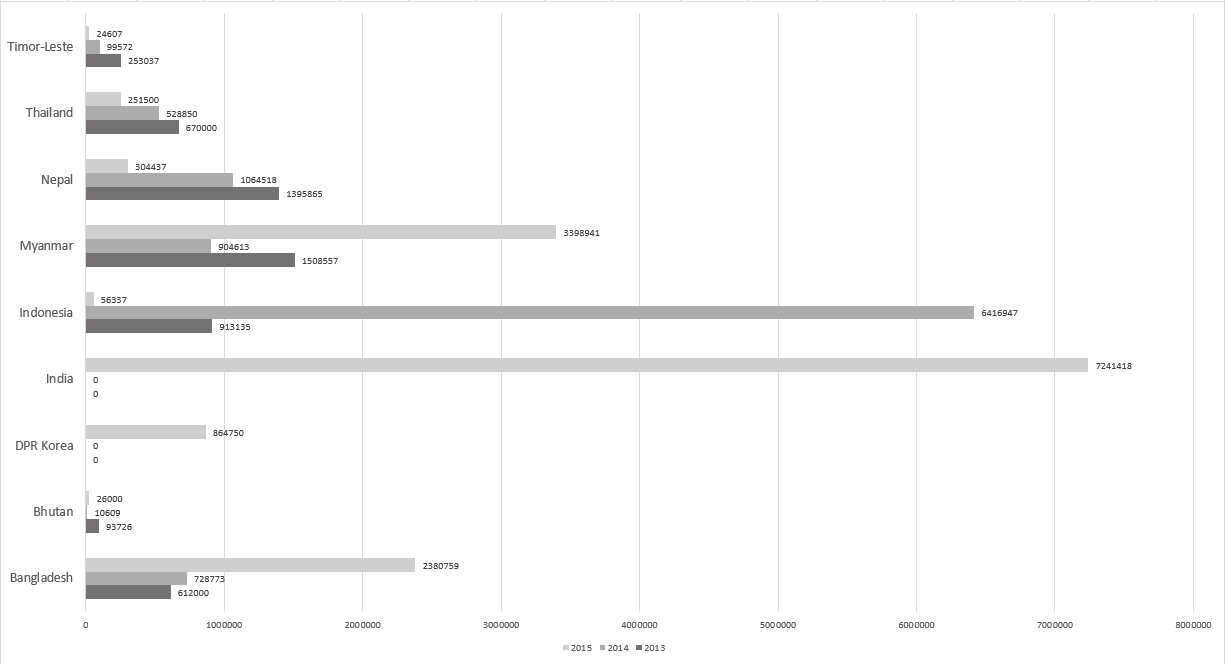 Mosquito net distribution in countries from South East Asia WHO region. Period 2013-2015.png Sebastian
19:43, 14 April 2017
1,225 × 664; 25 KB
-
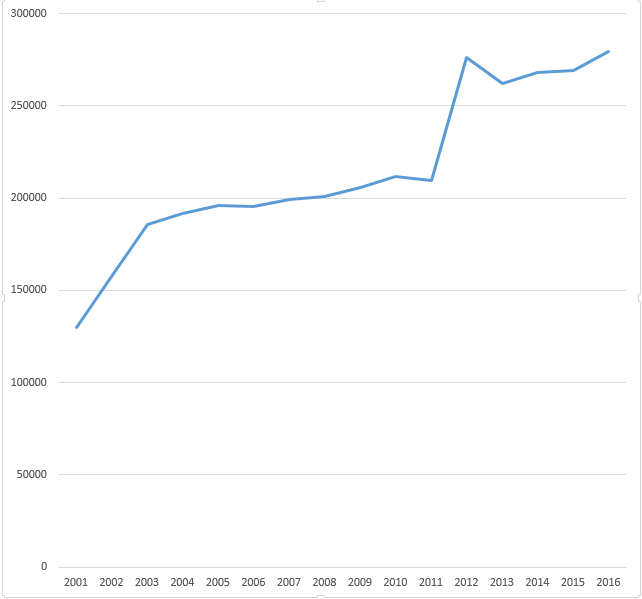
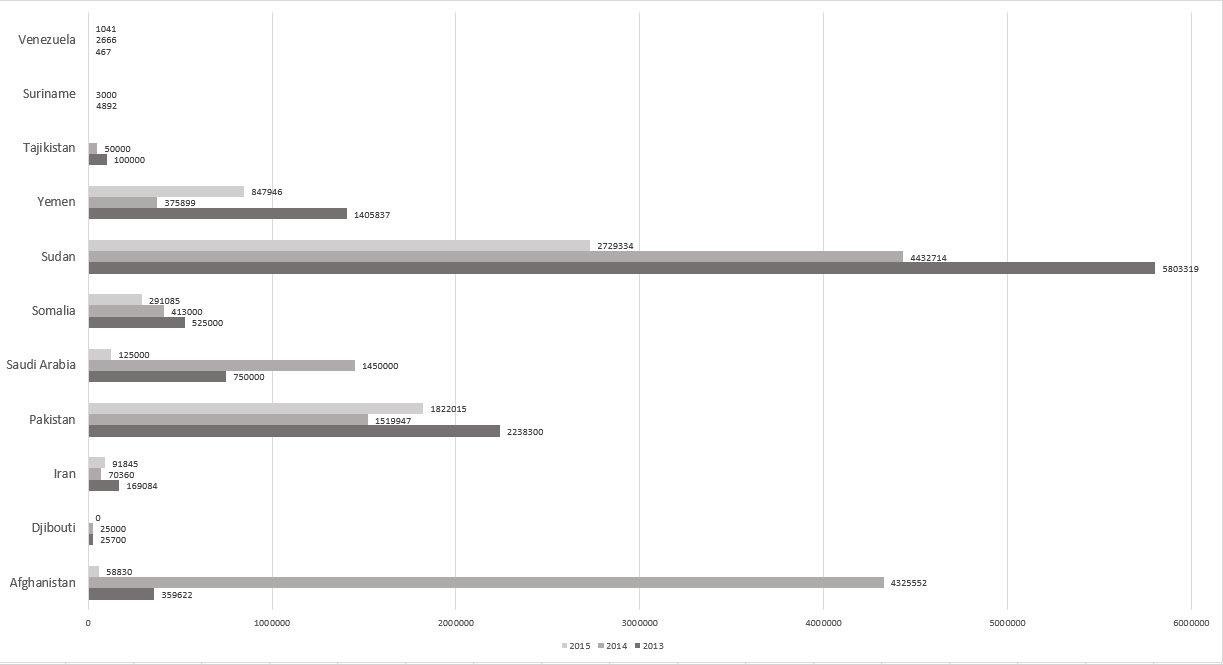 Mosquito net distribution in countries belonging to Americas, European and Eastern Mediterranean WHO regions. Period 2013-2015.png Sebastian
19:42, 14 April 2017
1,223 × 665; 26 KB
-
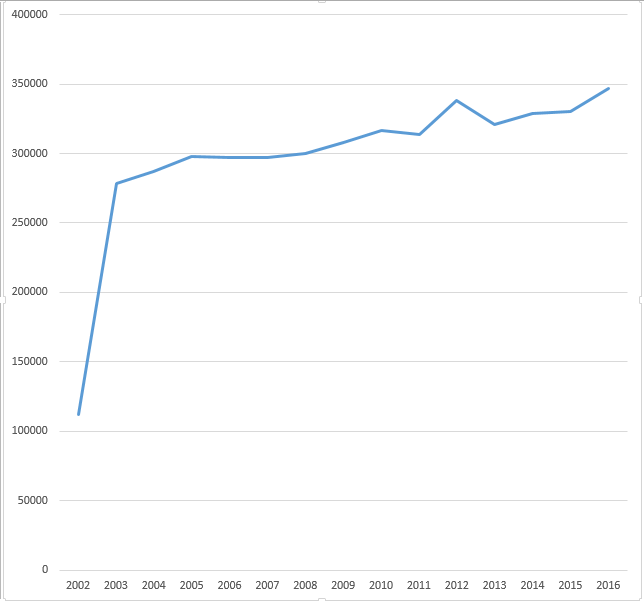
 Mosquito net distribution in countries from African WHO region. Period 2013-2015. Table 3.png Sebastian
19:29, 14 April 2017
1,226 × 664; 26 KB
-
 Mosquito net distribution in countries from African WHO region. Period 2013-2015. Table 2..png Sebastian
19:22, 14 April 2017
1,223 × 663; 32 KB
-
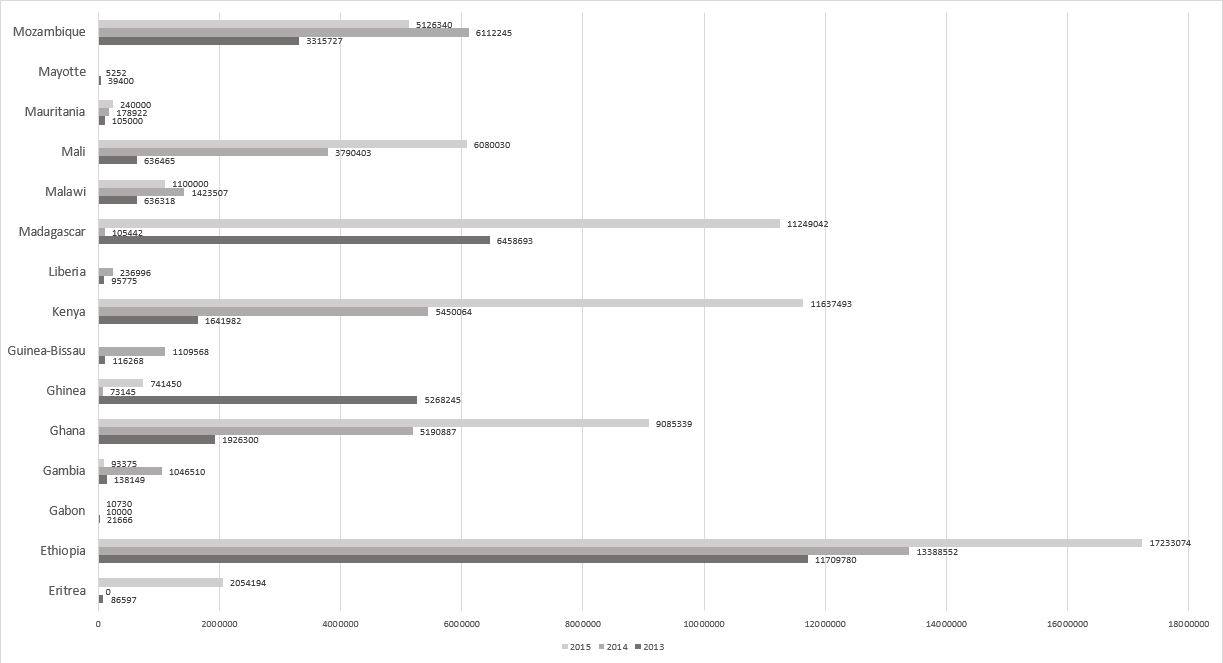
 Mosquito net distribution in countries from African WHO region. Period 2013-2015..png Sebastian
18:57, 14 April 2017
1,228 × 664; 30 KB
-
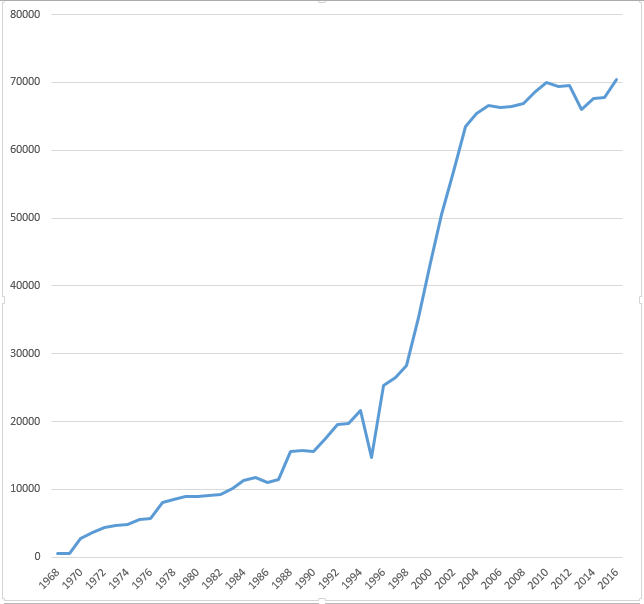
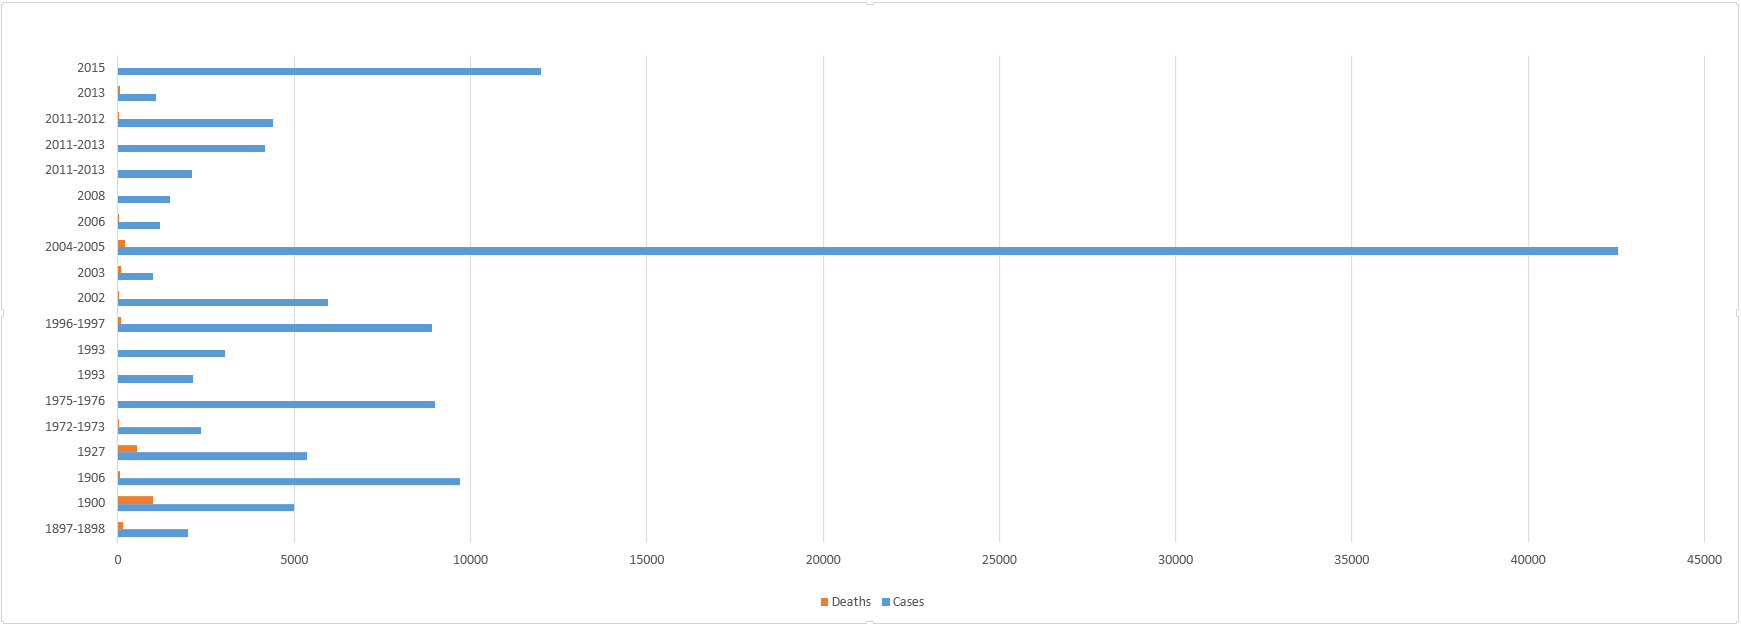 Number of cases and deaths due to typhoid fever, by outbreak.png Sebastian
18:27, 5 April 2017
1,741 × 626; 41 KB
-
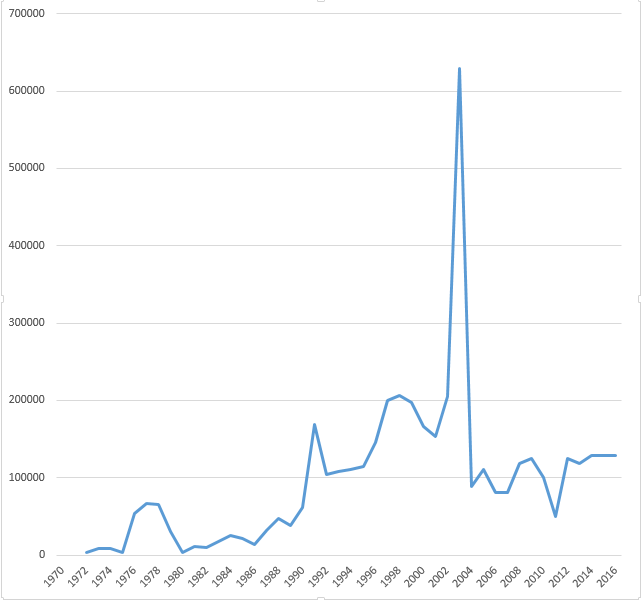
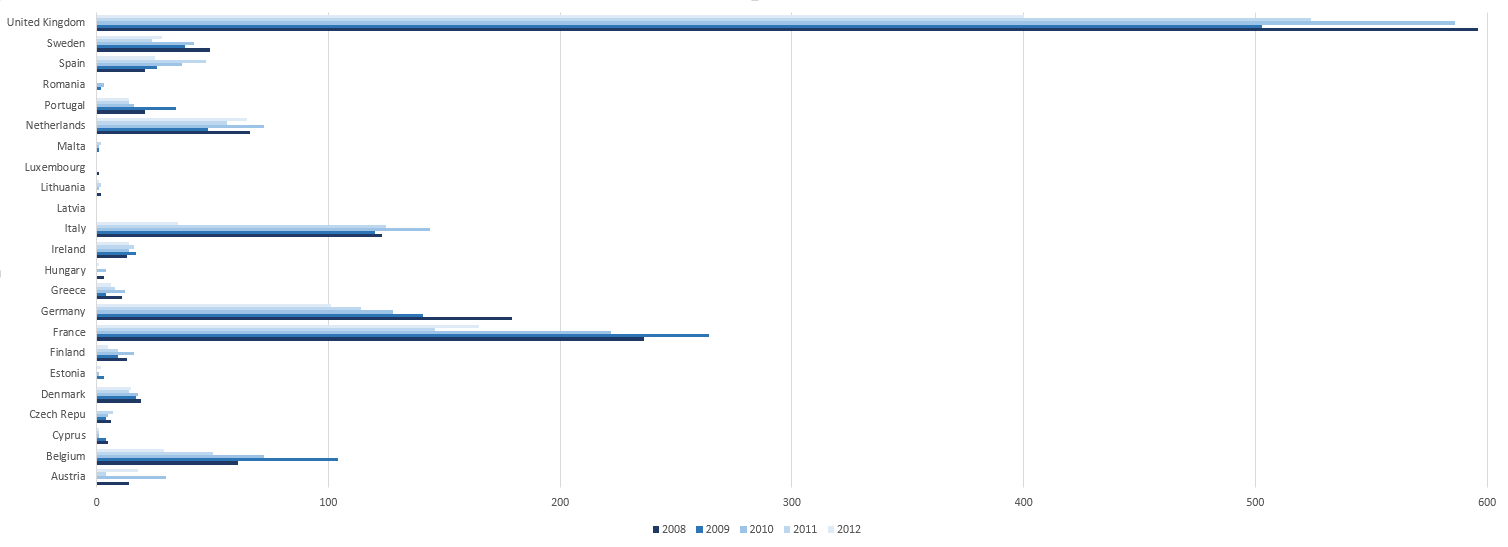 Number of confirmed typhoid-paratyphoid fever reported cases in European countries in the years 2008-2012.png Sebastian
18:24, 5 April 2017
1,508 × 547; 27 KB
-
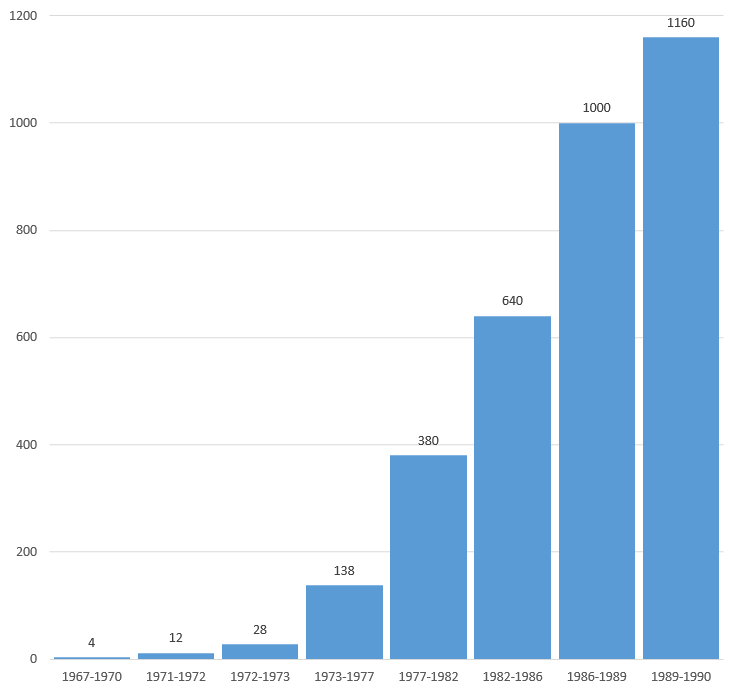
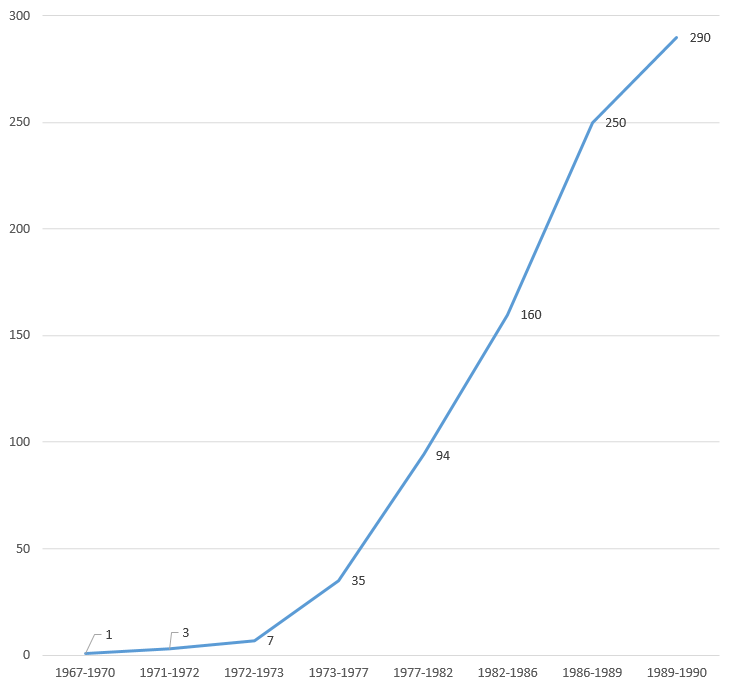
 Number of investigators involved in DNA sequence analysis per time period between 1967 and 1990.png Sebastian
04:26, 4 April 2017
737 × 692; 10 KB
-
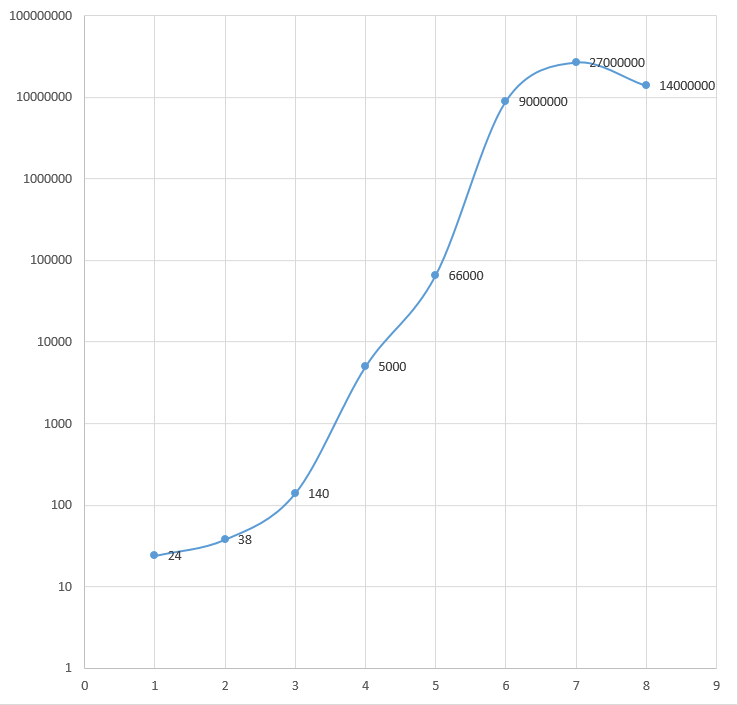
 DNA sequence analysis between 1967 and 1990. Nucleotides per year, per investigator.png Sebastian
04:24, 4 April 2017
740 × 694; 18 KB
-
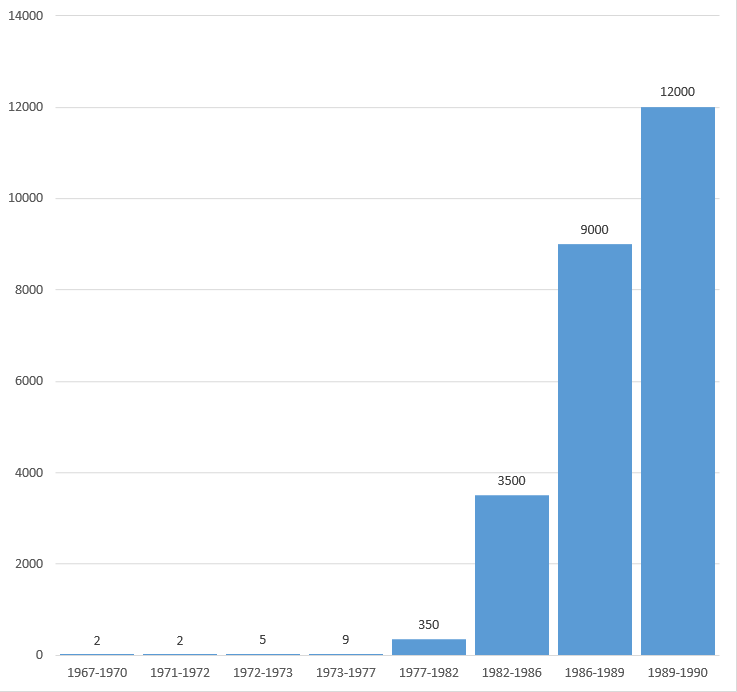
 Nucleotides determined per time period between 1967 and 1990.png Sebastian
04:20, 4 April 2017
738 × 705; 23 KB
-
 DNA sequence analysis between 1967 and 1990. Relative speed (per unit of speed).png Sebastian
04:15, 4 April 2017
735 × 691; 14 KB
-
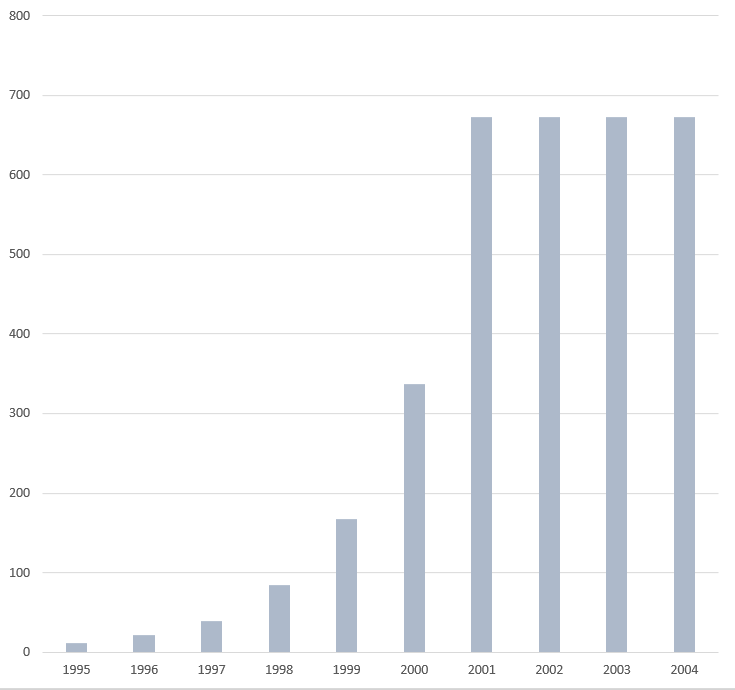
 DNA sequencing costs in the Human Genome Project. Genomic sequence (GB), cumulative.png Sebastian
22:19, 3 April 2017
734 × 711; 14 KB
-
 DNA sequencing costs in the Human Genome Project. Finished, per-base direct cost.png Sebastian
22:16, 3 April 2017
745 × 690; 16 KB
-
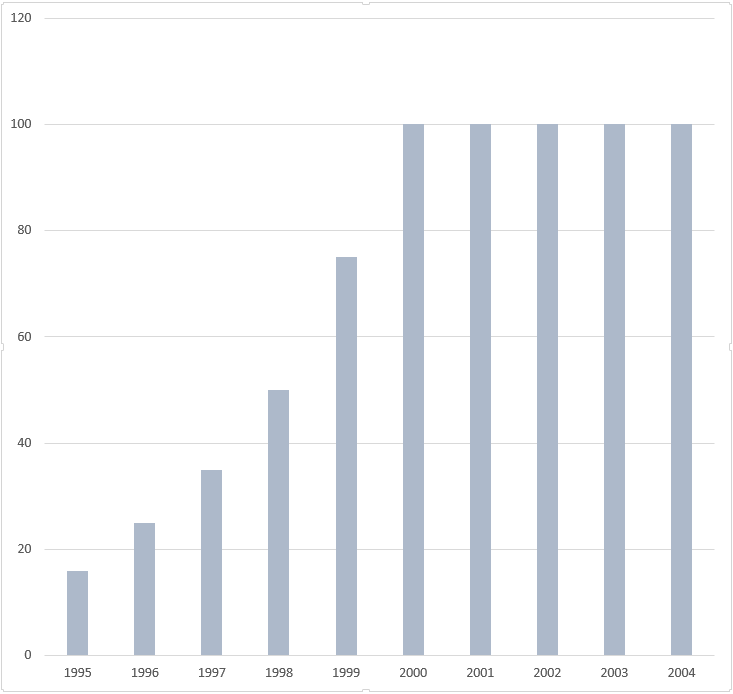
 DNA sequencing costs in the Human Genome Project. Genomic sequence (GB) per year.png Sebastian
22:13, 3 April 2017
735 × 690; 21 KB
-
 DNA sequencing costs in the Human Genome Project. Annual sequencing budget (in millions)..png Sebastian
22:08, 3 April 2017
733 × 694; 25 KB
-
-
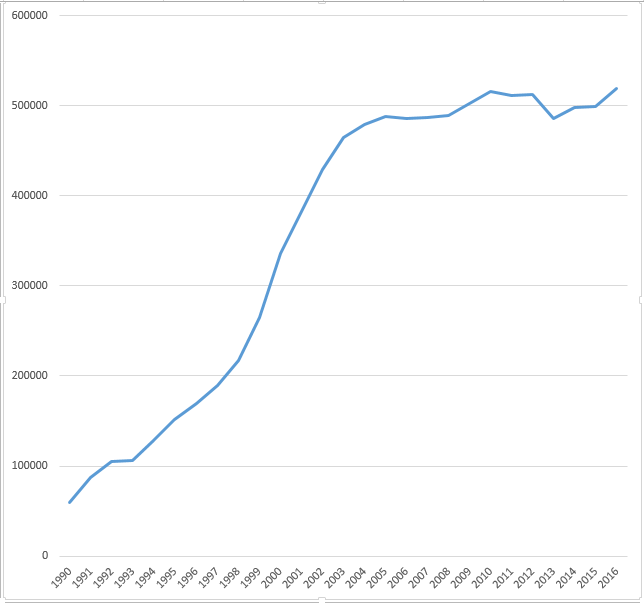
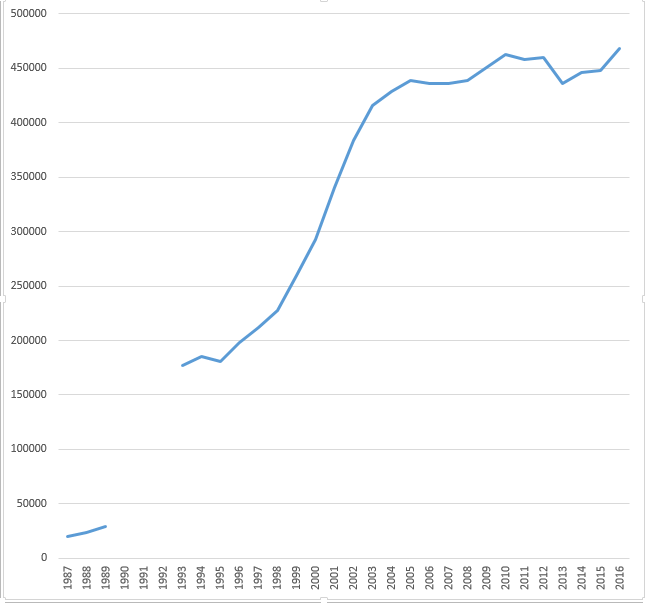
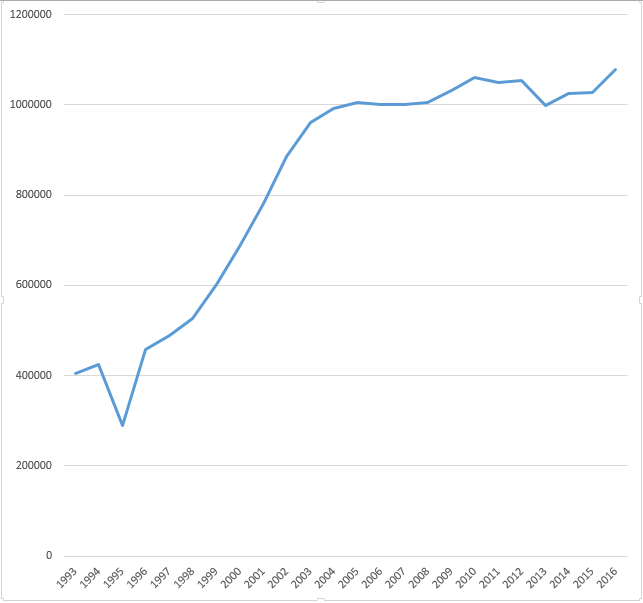
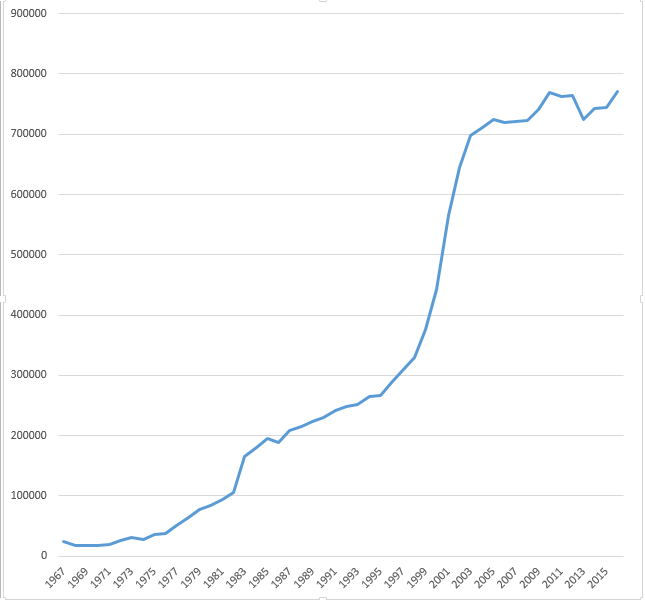
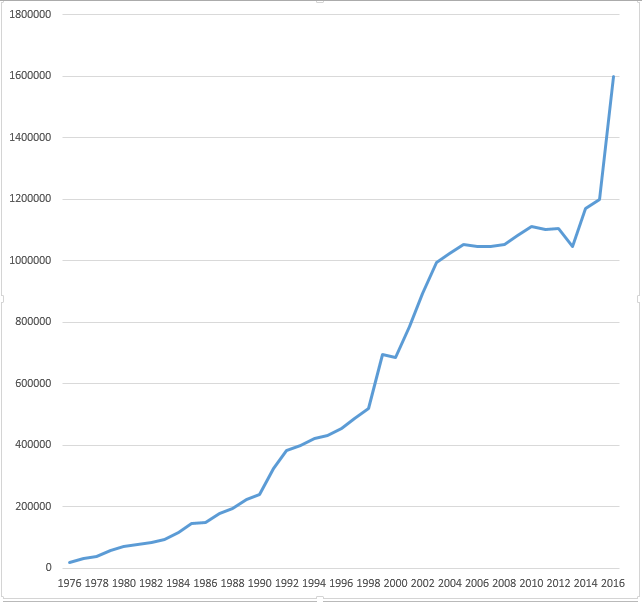
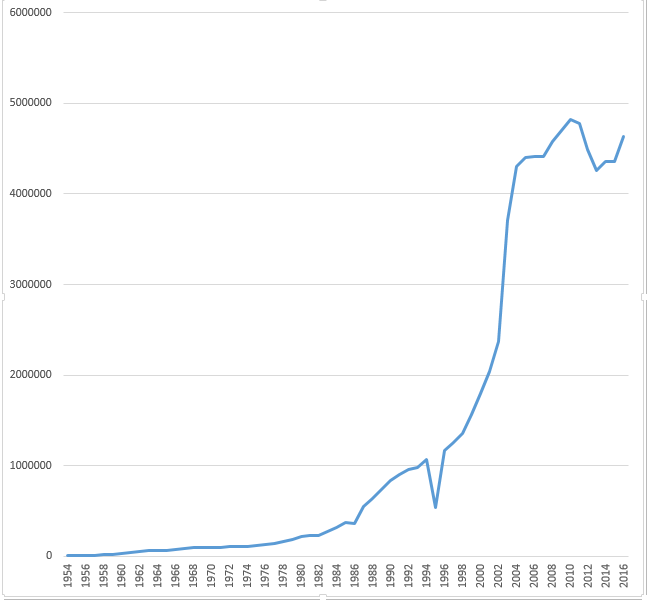
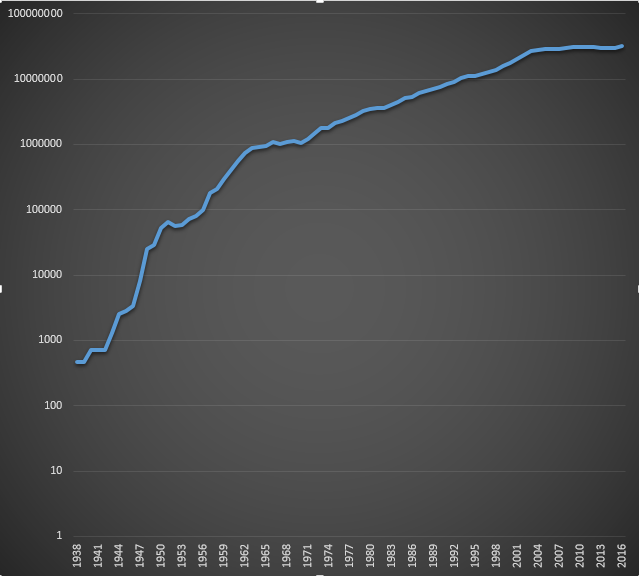
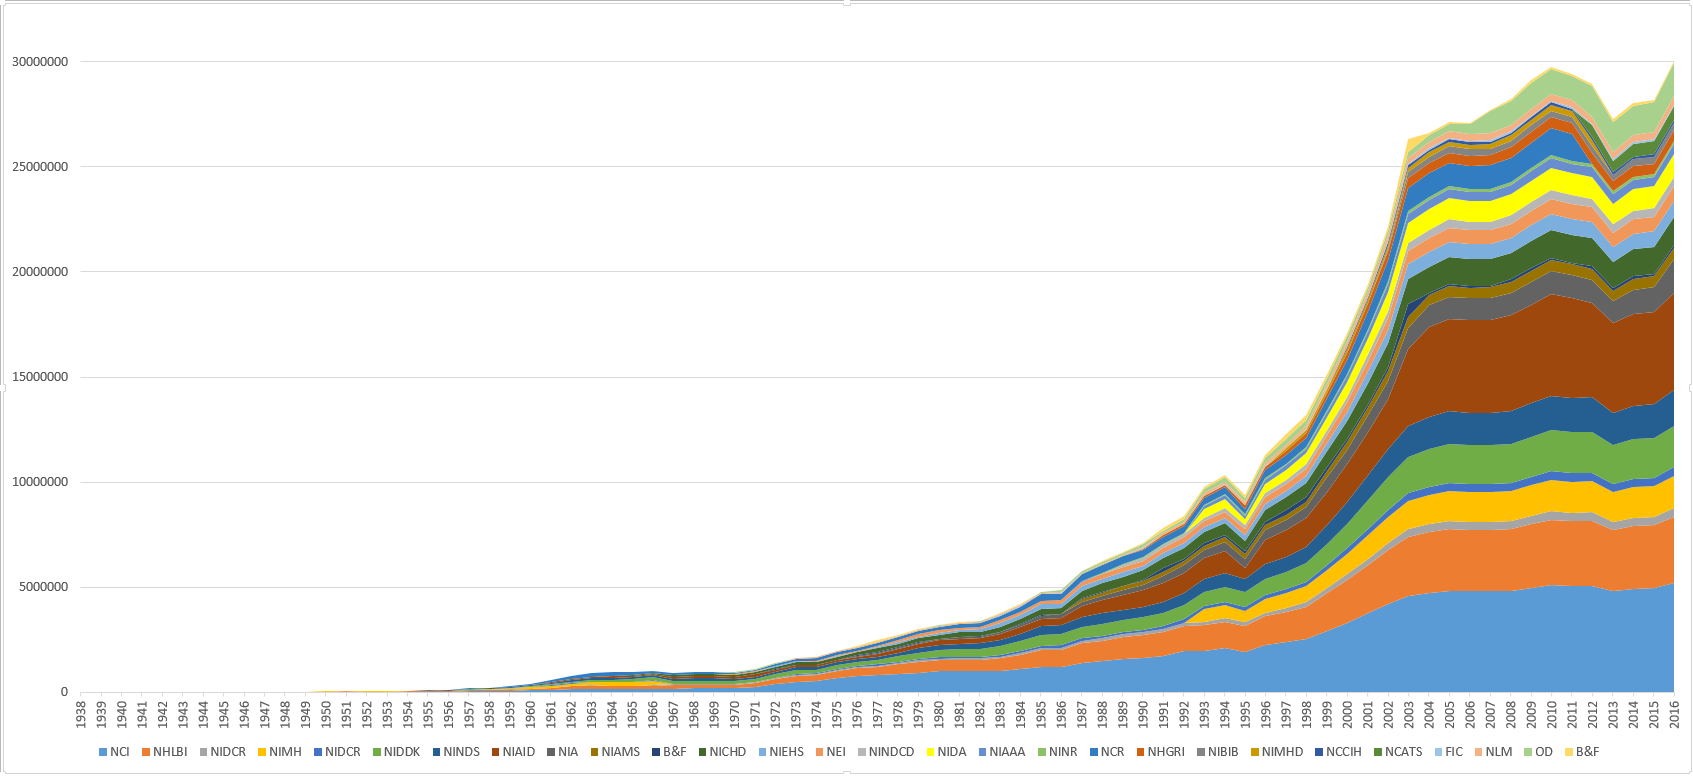 NIH congressional appropriations per year. In thousands of dollars. Cumulative.png Sebastian
18:55, 3 April 2017
1,693 × 776; 116 KB
-
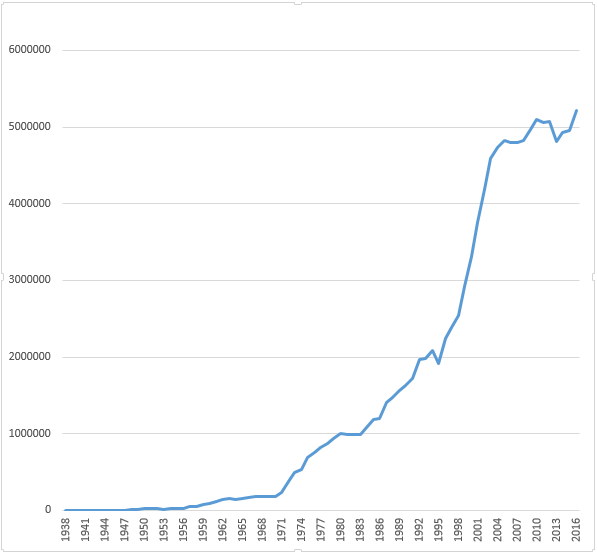
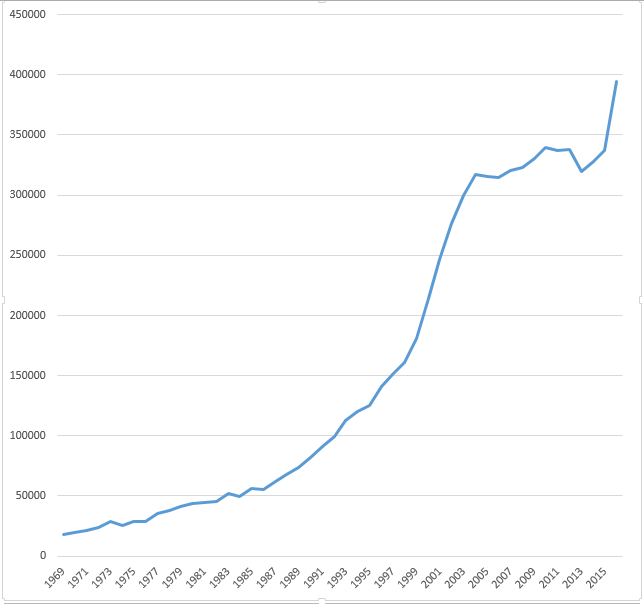
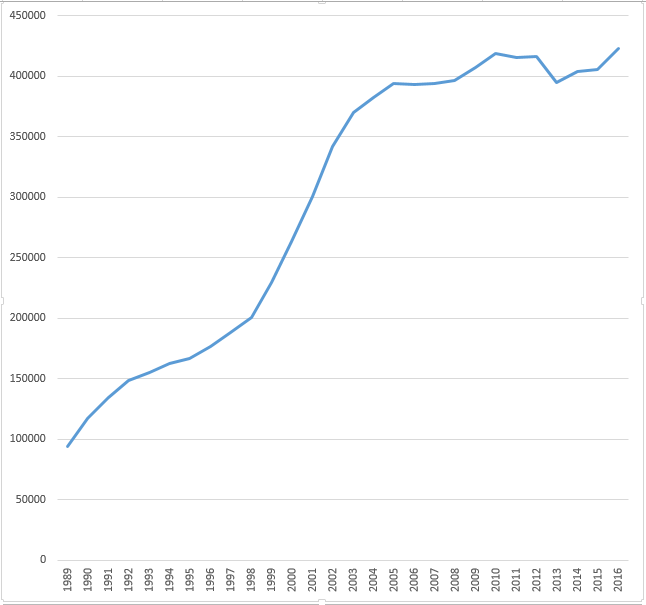
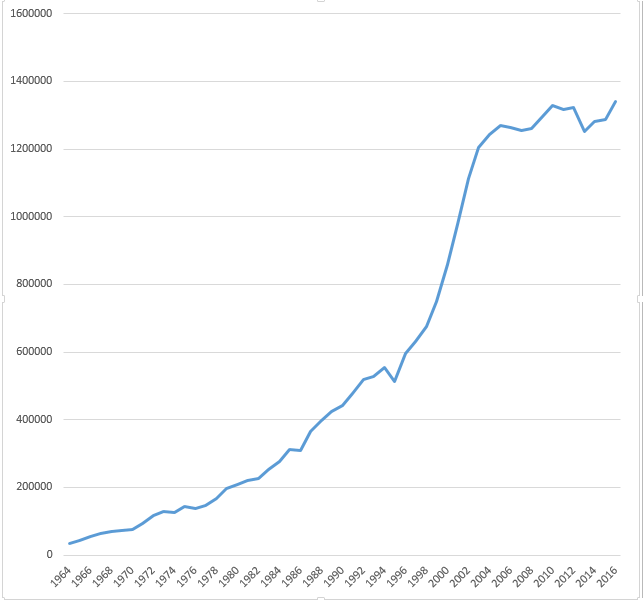
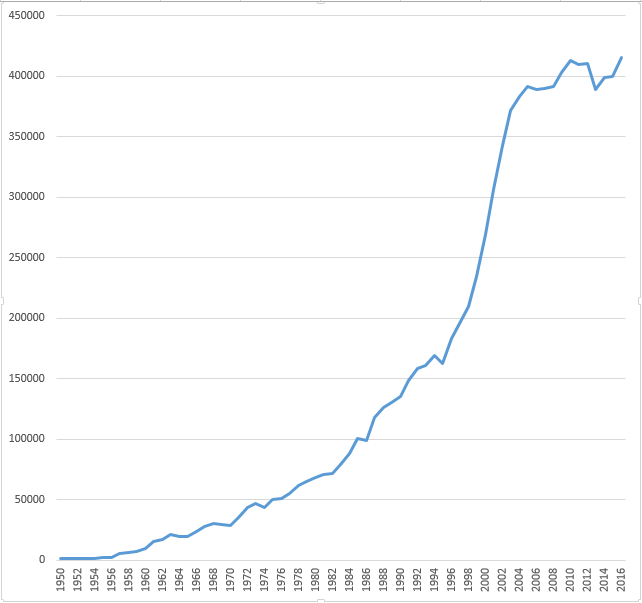
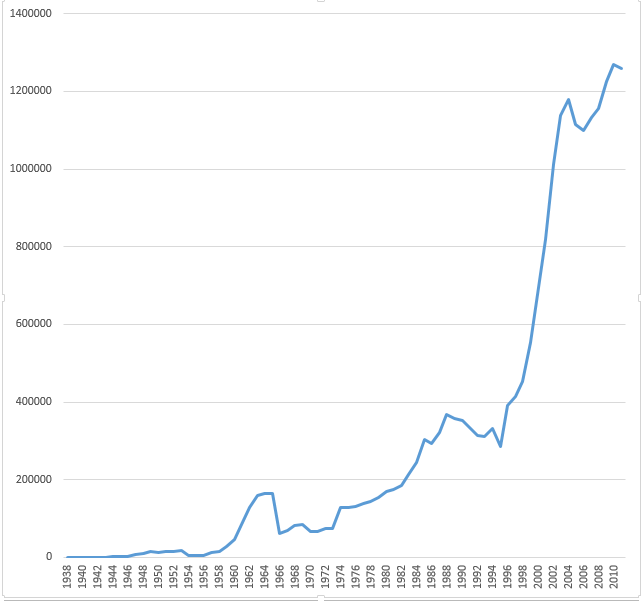
 NIH total congressional appropriations per year. In millions of dollars. Non-logarithmic.png Sebastian
18:53, 3 April 2017
640 × 578; 106 KB
-
-
-
-
-
-
-
-
-
-
-
-
-
-
-
-
-
-
-

-
-
-
-
-
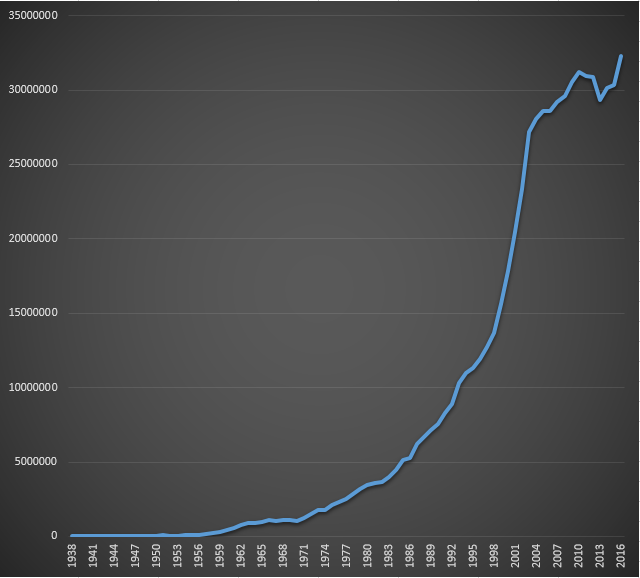
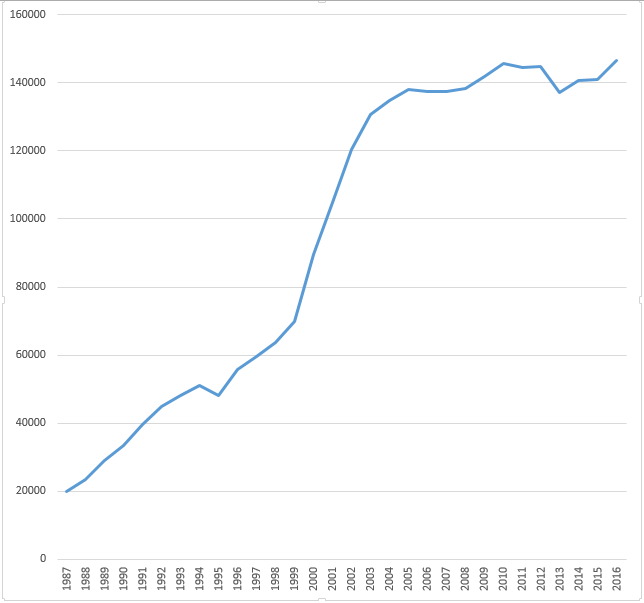
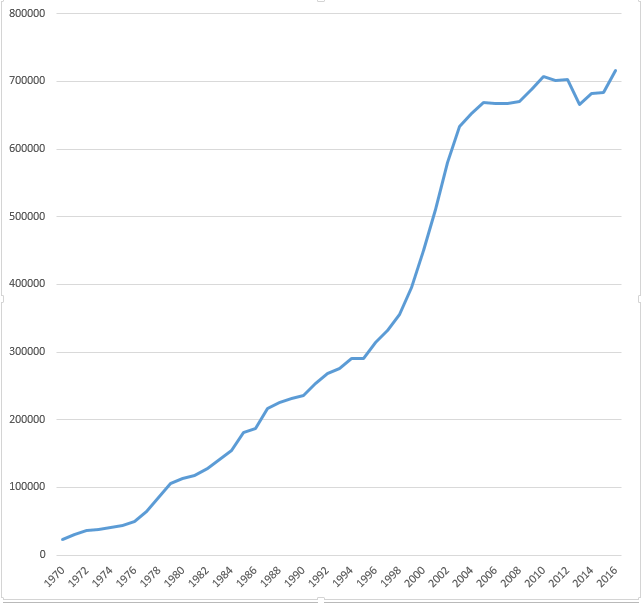
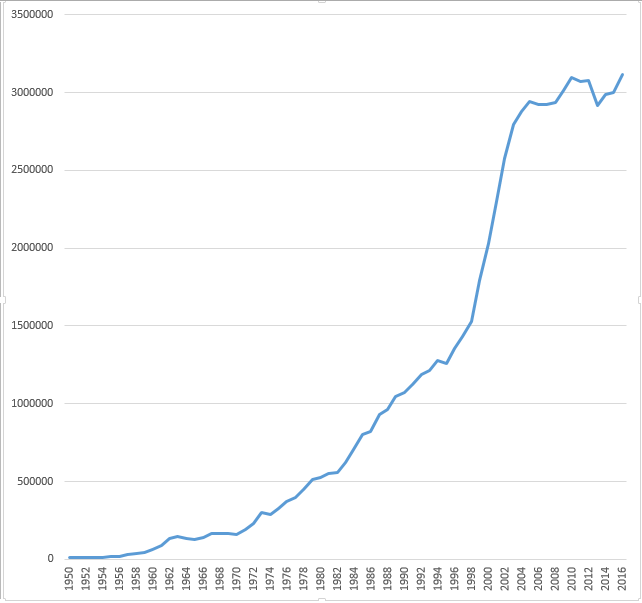
 NIH total congressional appropriations per year. In thousands of dollars.png.png Sebastian
17:35, 3 April 2017
639 × 576; 63 KB
-
-
-


.png)
,_cumulative.png)

_per_year.png)
..png)


.png)


.png)


.png)

.png)


