File:MRNAGooglescholar.PNG
Jump to navigation
Jump to search
Size of this preview: 800 × 395 pixels. Other resolution: 1,103 × 544 pixels.
Original file (1,103 × 544 pixels, file size: 88 KB, MIME type: image/png)
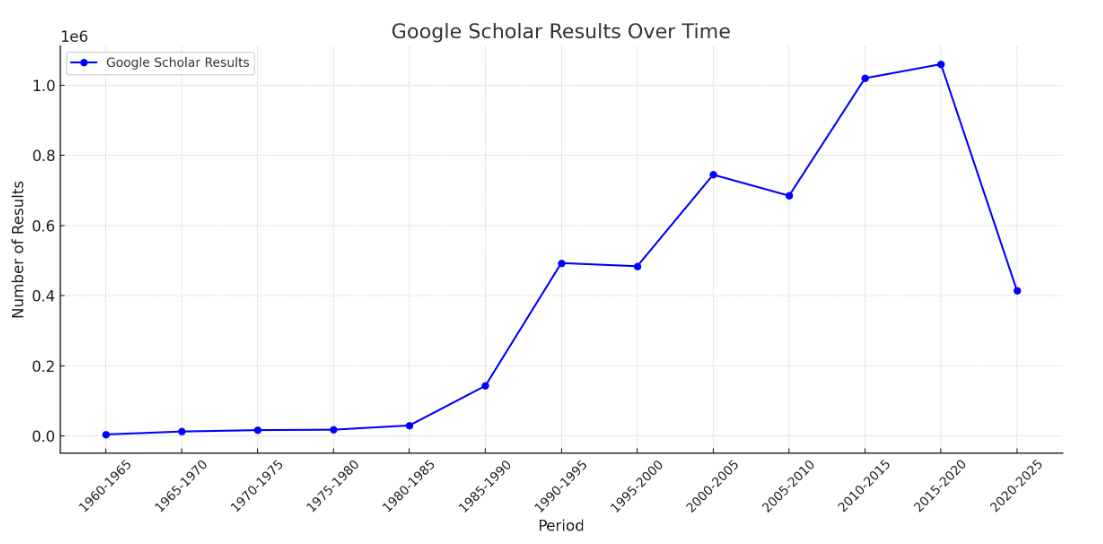
Here is a graph visualizing the Google Scholar results over time. It shows a noticeable growth in results, especially between 1985 and 2020, followed by a decline in the 2020-2025 period.
File history
Click on a date/time to view the file as it appeared at that time.
| Date/Time | Thumbnail | Dimensions | User | Comment | |
|---|---|---|---|---|---|
| current | 04:59, 9 January 2025 | | 1,103 × 544 (88 KB) | Sebastian (talk | contribs) | Here is a graph visualizing the Google Scholar results over time. It shows a noticeable growth in results, especially between 1985 and 2020, followed by a decline in the 2020-2025 period. |
You cannot overwrite this file.
File usage
The following page uses this file: