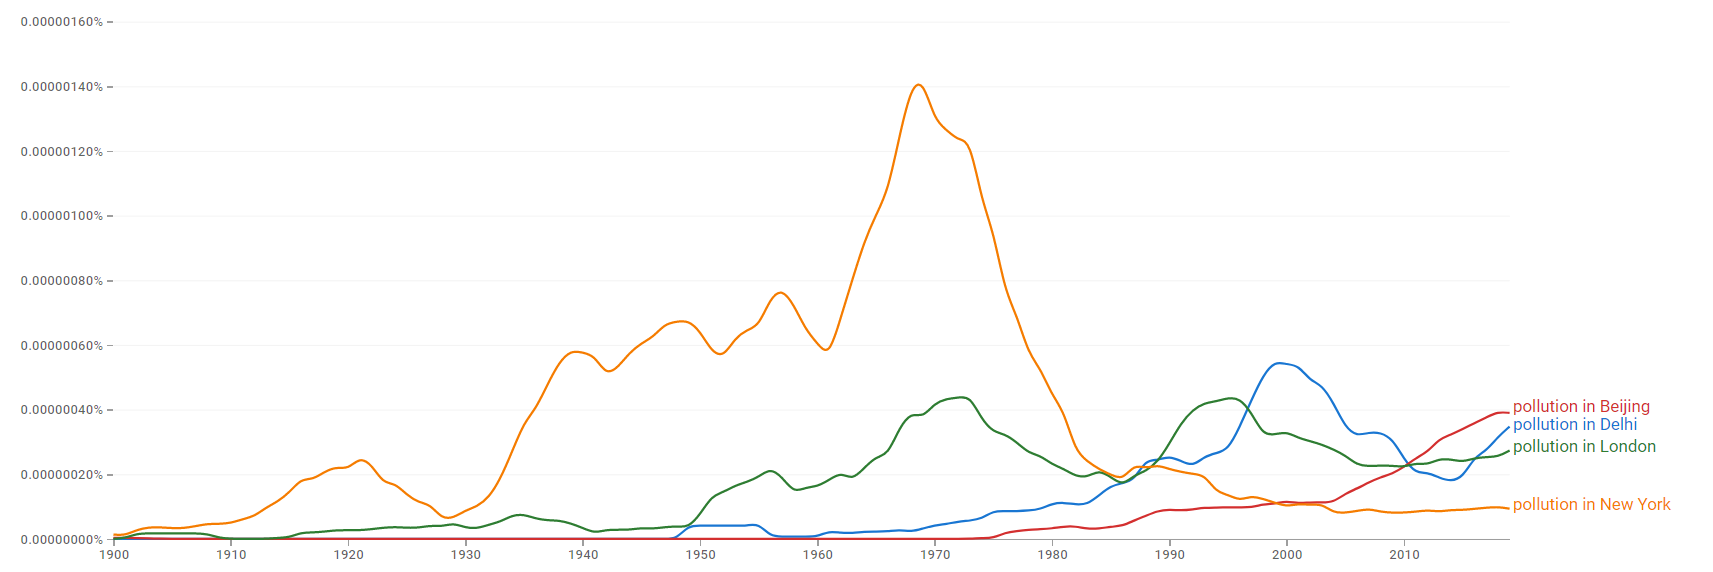
File:Pollution in Delhi, pollution in Beijing, pollution in London and pollution in New York ngram.png
From Timelines

Size of this preview: 800 × 267 pixels. Other resolutions: 320 × 107 pixels | 1,713 × 572 pixels.
Original file (1,713 × 572 pixels, file size: 64 KB, MIME type: image/png)
The comparative chart shows Google Ngram Viewer data for Pollution in Delhi, pollution in Beijing, pollution in London and pollution in New York, from 1900 to 2019.[1]
- ↑ "Pollution in Delhi, pollution in Beijing, pollution in London and pollution in New York". books.google.com. Retrieved 21 April 2021.
File history
Click on a date/time to view the file as it appeared at that time.
| Date/Time | Thumbnail | Dimensions | User | Comment | |
|---|---|---|---|---|---|
| current | 17:02, 20 April 2021 | 1,713 × 572 (64 KB) | Sebastian (talk | contribs) | The comparative chart shows {{w|Google Ngram Viewer}} data for Pollution in Delhi, pollution in Beijing, pollution in London and pollution in New York, from 1900 to 2019.<ref>{{cite web |title=Pollution in Delhi, pollution in Beijing, pollution in Lond... |
- You cannot overwrite this file.
File usage
The following page links to this file: