File list
Jump to navigation
Jump to search
This special page shows all uploaded files.
| Date | Name | Thumbnail | Size | User | Description | Versions |
|---|---|---|---|---|---|---|
| 16:52, 3 April 2017 | Test.png (file) | 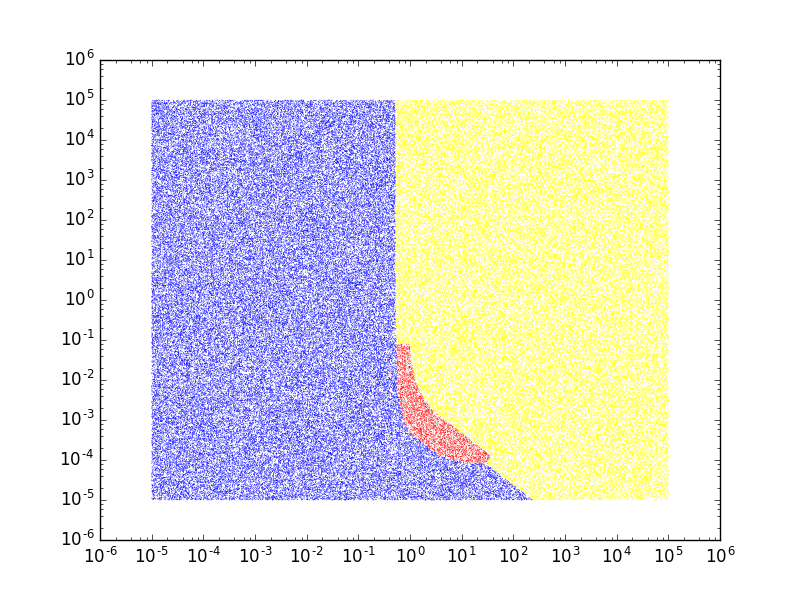 |
393 KB | Issa (talk | contribs) | test upload | 1 |
| 17:20, 3 April 2017 | B&F.png (file) | 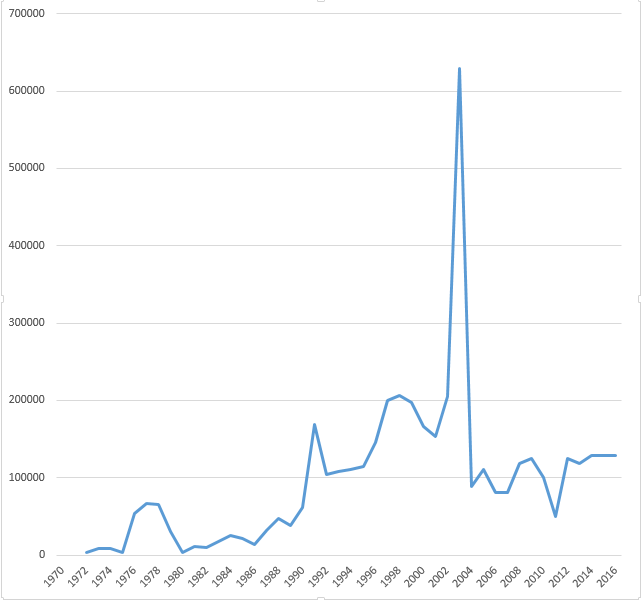 |
17 KB | Sebastian (talk | contribs) | NIH Buildings and Facilities (B&F) congressional appropriations per year. In thousands of dollars. | 1 |
| 17:25, 3 April 2017 | FIC.png (file) | 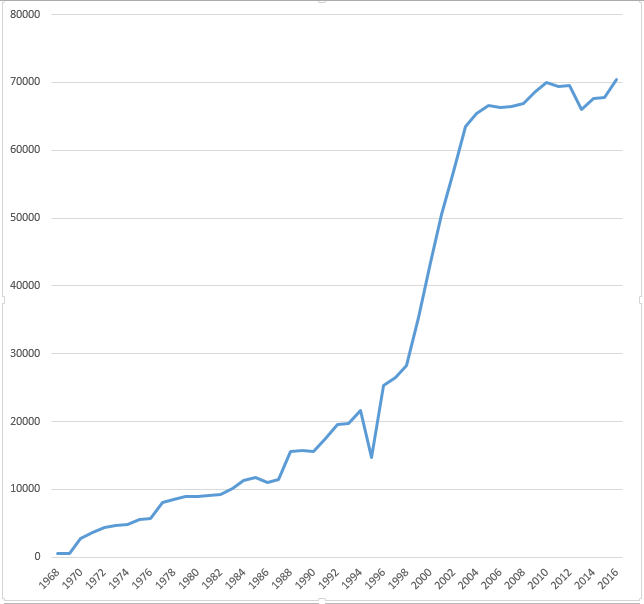 |
15 KB | Sebastian (talk | contribs) | Fogarty International Center (FIC) congressional appropriations per year. In thousands of dollars.<ref name="NIH congressional appropriations"/> | 1 |
| 17:35, 3 April 2017 | NIH total congressional appropriations per year. In thousands of dollars.png.png (file) | 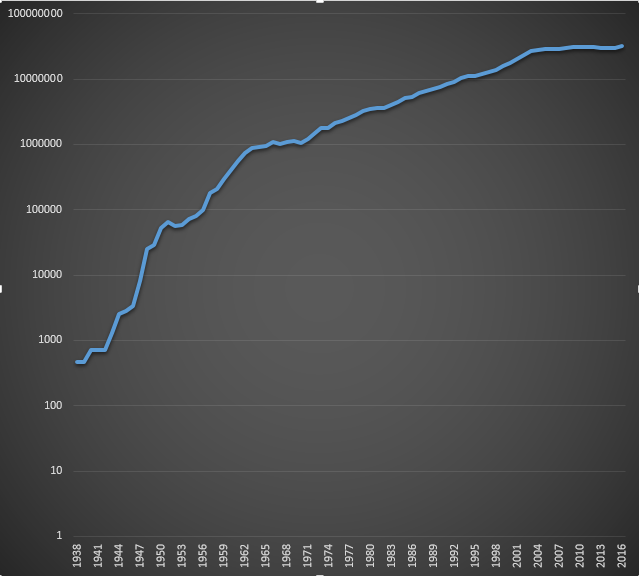 |
63 KB | Sebastian (talk | contribs) | National Institutes of Health total congressional appropriations per year. In thousands of dollars. Logarithmic. | 1 |
| 17:40, 3 April 2017 | NCRR.png (file) | 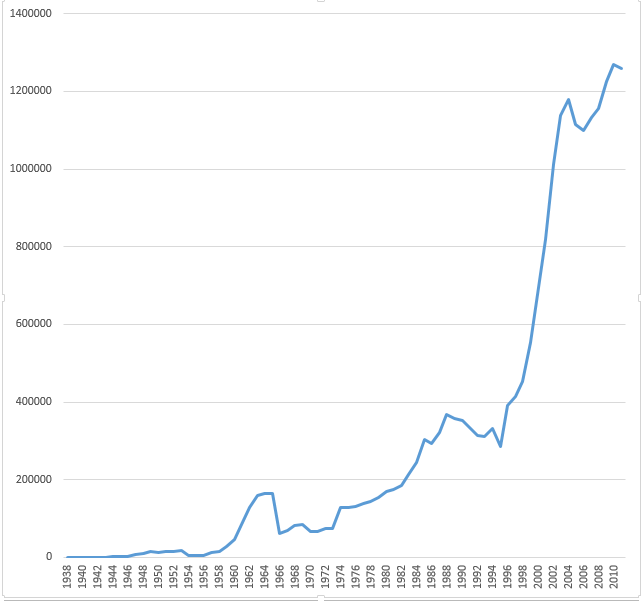 |
16 KB | Sebastian (talk | contribs) | National Center for Research Resources (NCRR) congressional appropriations per year. In thousands of dollars. | 1 |
| 17:44, 3 April 2017 | NHLBI.png (file) | 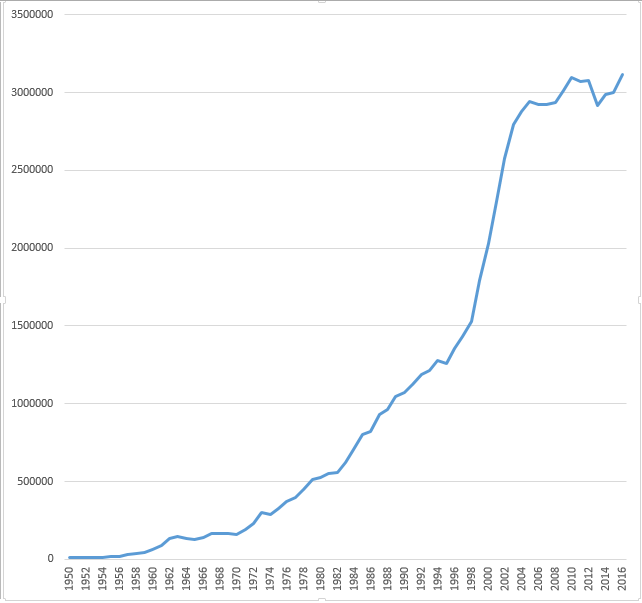 |
15 KB | Sebastian (talk | contribs) | National Heart, Lung, and Blood Institute (NHLBI) congressional appropriations per year. In thousands of dollars. | 1 |
| 17:49, 3 April 2017 | NIDCR.png (file) | 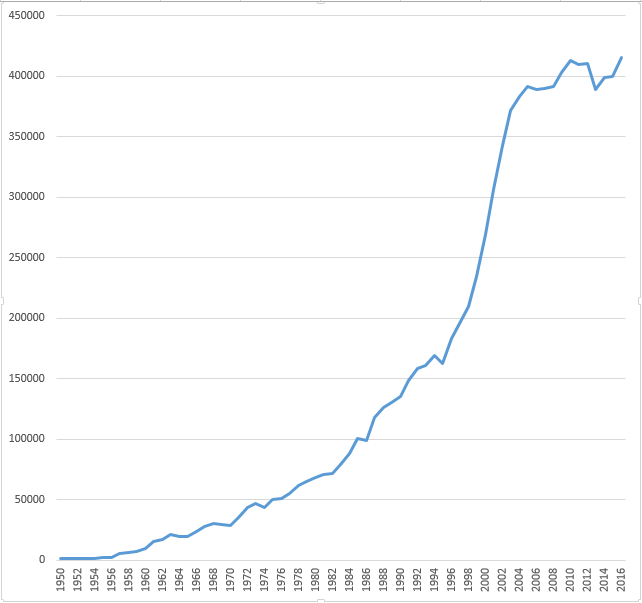 |
14 KB | Sebastian (talk | contribs) | National Institute of Dental and Craniofacial Research (NIDCR) congressional appropriations per year. In thousands of dollars. | 1 |
| 17:53, 3 April 2017 | NIDDK.png (file) | 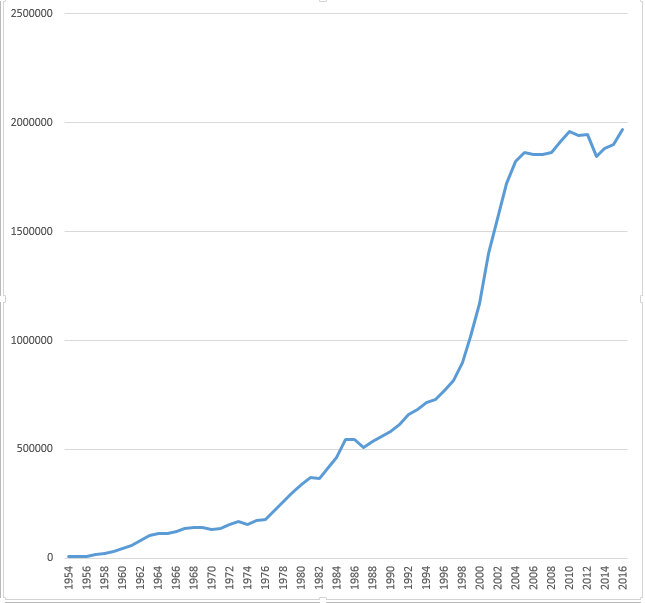 |
14 KB | Sebastian (talk | contribs) | National Institute of Diabetes and Digestive and Kidney Diseases (NIDDK) congressional appropriations per year. In thousands of dollars. | 1 |
| 18:08, 3 April 2017 | NINDS.png (file) | 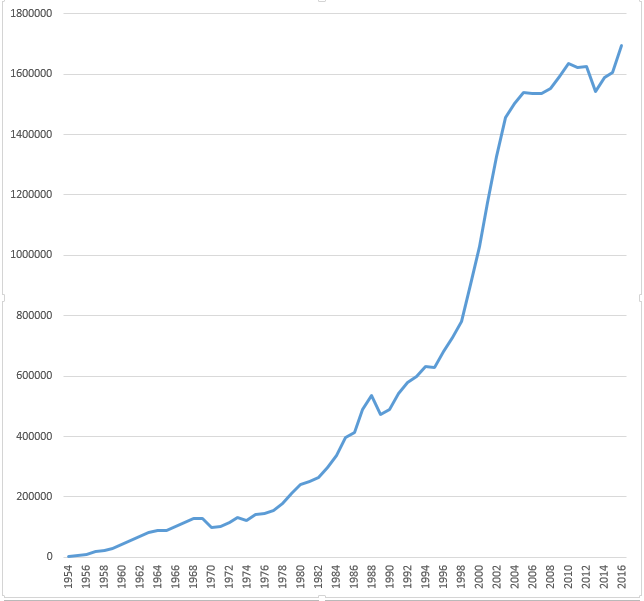 |
16 KB | Sebastian (talk | contribs) | National Institute of Neurological Disorders and Stroke (NINDS) congressional appropriations per year. In thousands of dollars. | 1 |
| 18:09, 3 April 2017 | NIAID.png (file) | 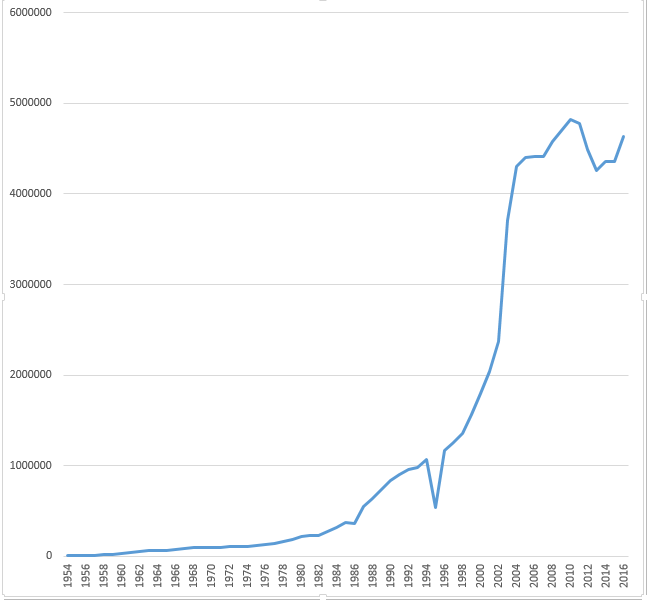 |
13 KB | Sebastian (talk | contribs) | National Institute of Allergy and Infectious Diseases (NIAID) Congressional appropriations per year. In thousands of dollars. | 1 |
| 18:15, 3 April 2017 | NIA.png (file) | 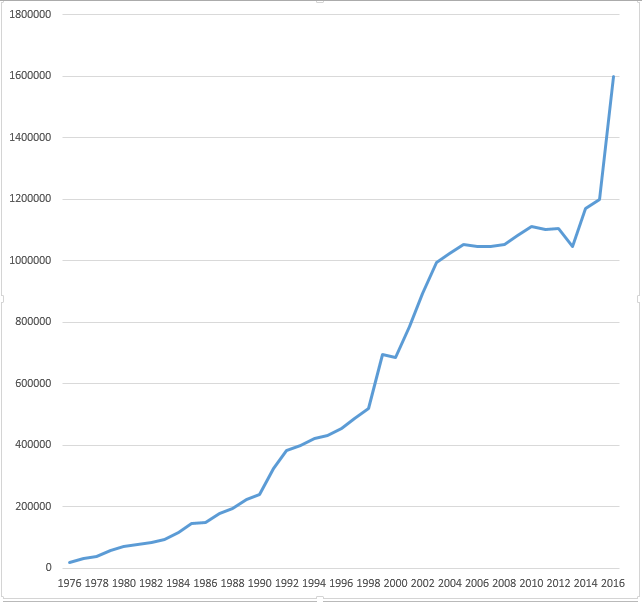 |
14 KB | Sebastian (talk | contribs) | National Institute on Aging (NIA) congressional appropriations per year. In thousands of dollars. | 1 |
| 18:17, 3 April 2017 | NIMH.png (file) | 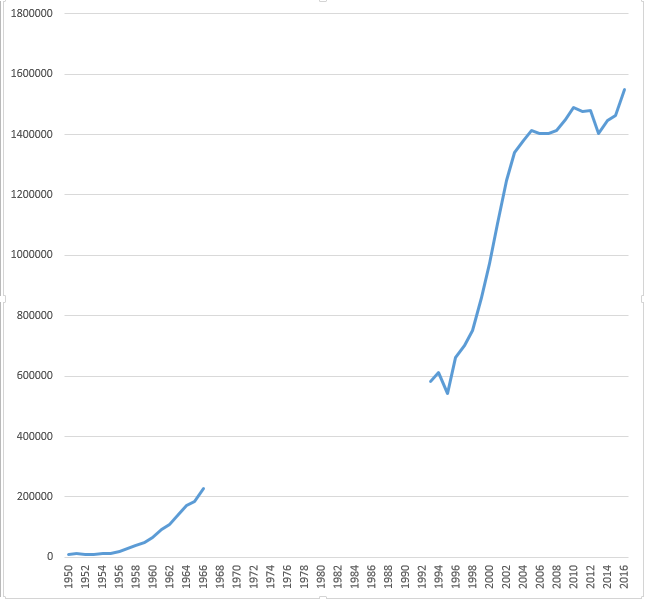 |
14 KB | Sebastian (talk | contribs) | National Institute of Mental Health (NIMH) congressional appropriations per year. In thousands of dollars. | 1 |
| 18:17, 3 April 2017 | NIAMS.png (file) | 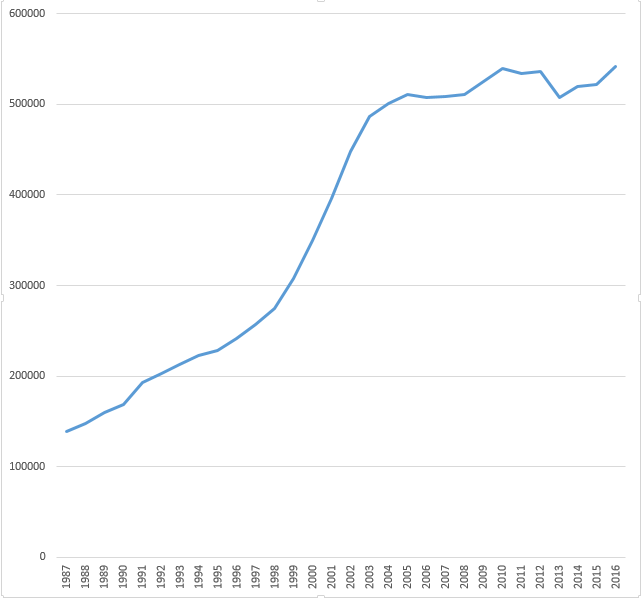 |
13 KB | Sebastian (talk | contribs) | National Institute of Arthritis and Musculoskeletal and Skin Diseases (NIAMS) congressional appropriations per year. In thousands of dollars. | 1 |
| 18:18, 3 April 2017 | NICHD.png (file) | 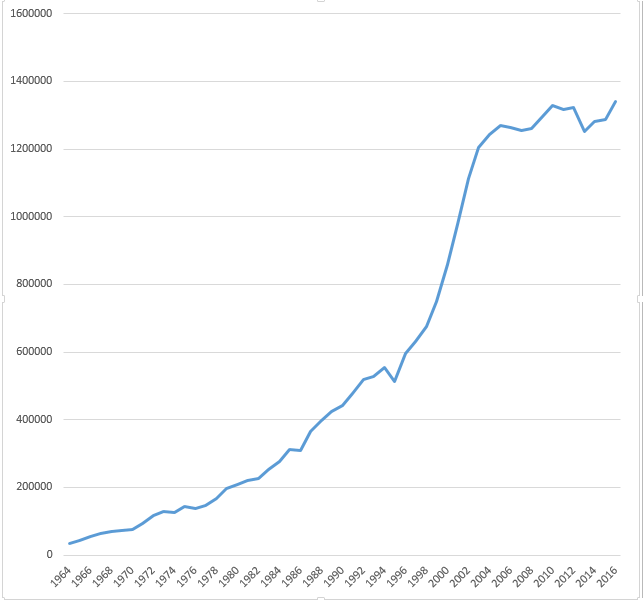 |
14 KB | Sebastian (talk | contribs) | Eunice Kennedy Shriver National Institute of Child Health and Human Development (NICHD) congressional appropriations per year. In thousands of dollars. | 1 |
| 18:21, 3 April 2017 | NIEHS.png (file) | 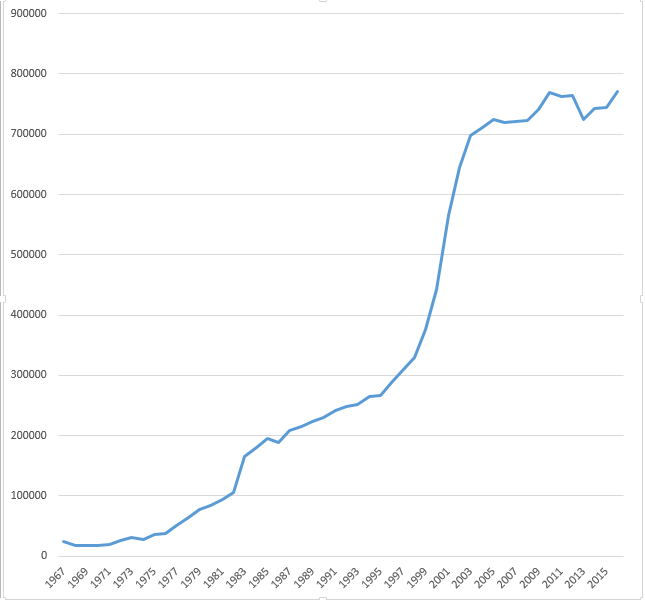 |
15 KB | Sebastian (talk | contribs) | National Institute of Environmental Health Sciences (NIEHS) congressional appropriations per year. In thousands of dollars. | 1 |
| 18:25, 3 April 2017 | (NEI).png (file) | 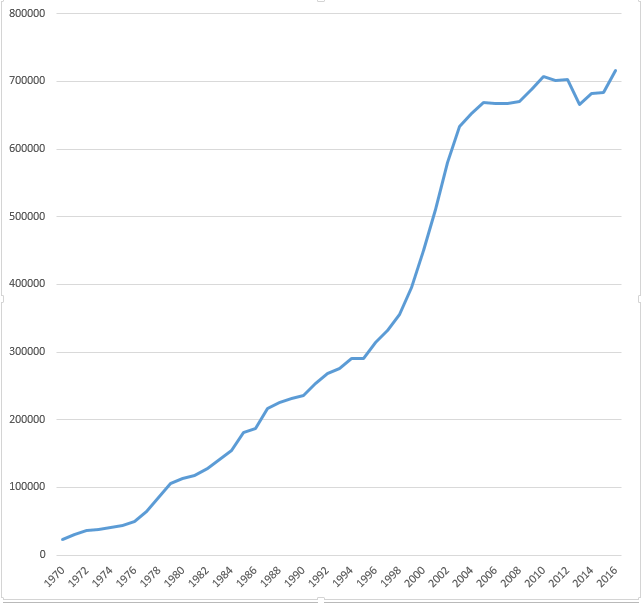 |
13 KB | Sebastian (talk | contribs) | National Eye Institute (NEI) congressional appropriations per year. In thousands of dollars. | 1 |
| 18:26, 3 April 2017 | NIDCD.png (file) | 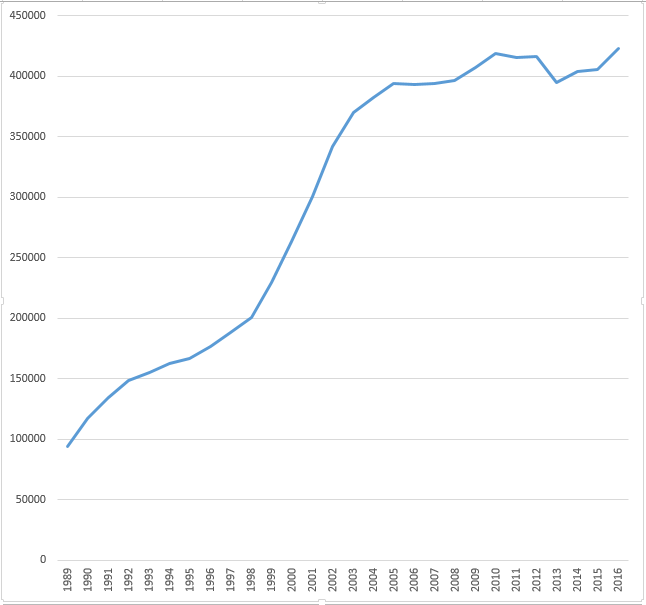 |
12 KB | Sebastian (talk | contribs) | National Institute on Deafness and Other Communication Disorders (NIDCD) congressional appropriations per year. In thousands of dollars. | 1 |
| 18:31, 3 April 2017 | NIDA (NIH).png (file) | 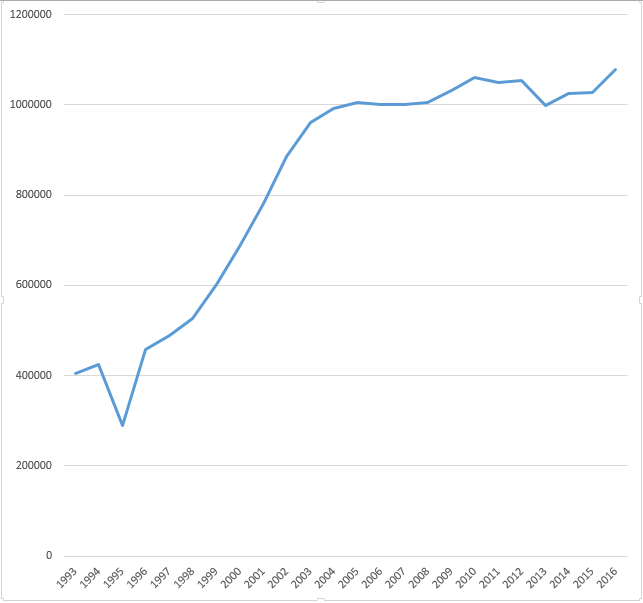 |
13 KB | Sebastian (talk | contribs) | National Institute on Drug Abuse (NIDA) congressional appropriations per year. In thousands of dollars. | 1 |
| 18:32, 3 April 2017 | NINR.png (file) | 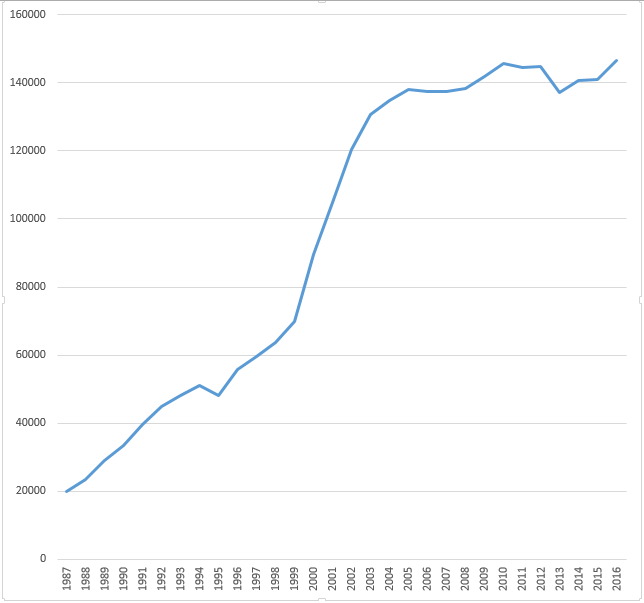 |
14 KB | Sebastian (talk | contribs) | National Institute of Nursing Research (NINR) congressional appropriations per year. In thousands of dollars. | 1 |
| 18:33, 3 April 2017 | NIAAA.png (file) | 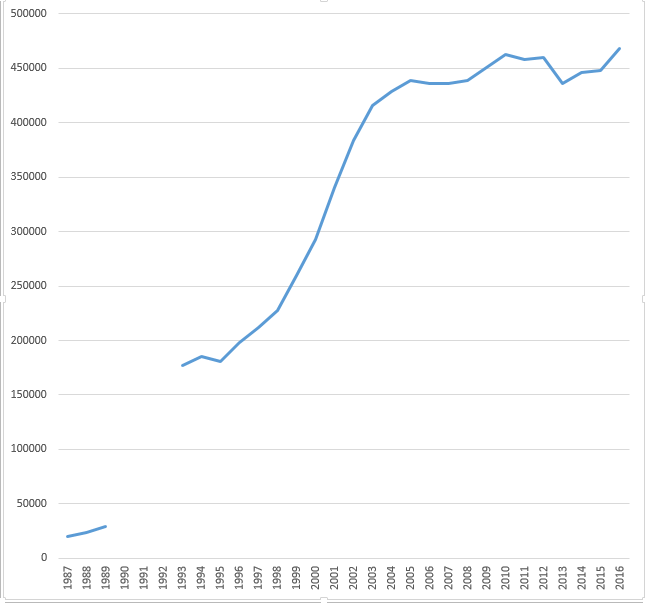 |
14 KB | Sebastian (talk | contribs) | National Institute on Alcohol Abuse and Alcoholism (NIAAA) congressional appropriations per year. In thousands of dollars. | 1 |
| 18:34, 3 April 2017 | NLM (NIH).png (file) | 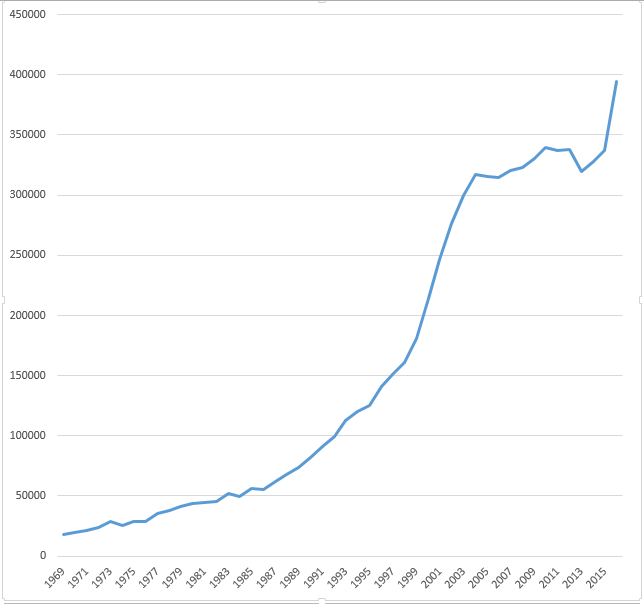 |
14 KB | Sebastian (talk | contribs) | National Library of Medicine (NLM) congressional appropriations per year. In thousands of dollars. | 1 |
| 18:47, 3 April 2017 | NHGRI.png (file) | 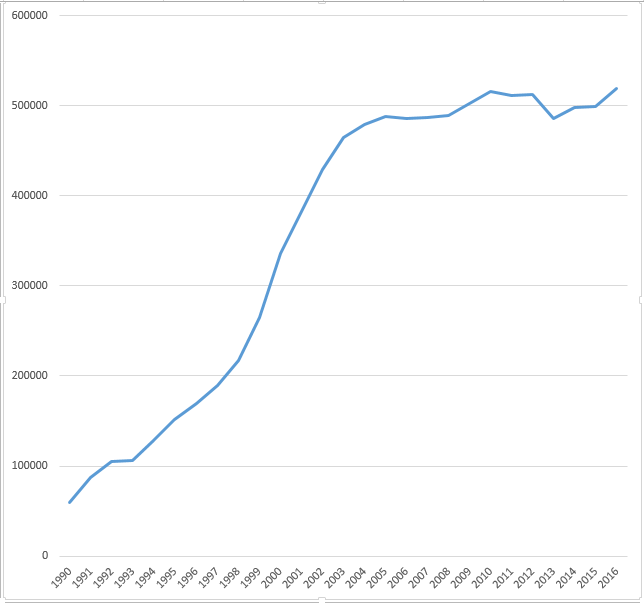 |
13 KB | Sebastian (talk | contribs) | National Human Genome Research Institute (NHGRI) congressional appropriations per year. In thousands of dollars. | 1 |
| 18:47, 3 April 2017 | NIBIB.png (file) | 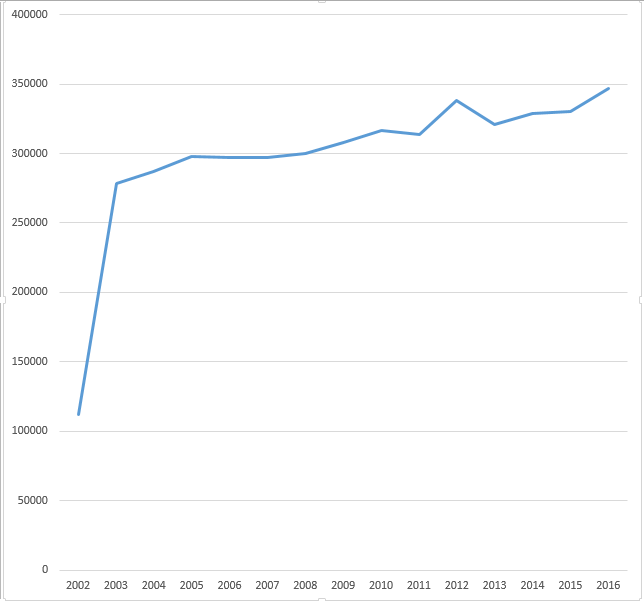 |
12 KB | Sebastian (talk | contribs) | National Institute of Biomedical Imaging and Bioengineering (NIBIB) congressional appropriations per year. In thousands of dollars. | 1 |
| 18:48, 3 April 2017 | NIMHD.png (file) | 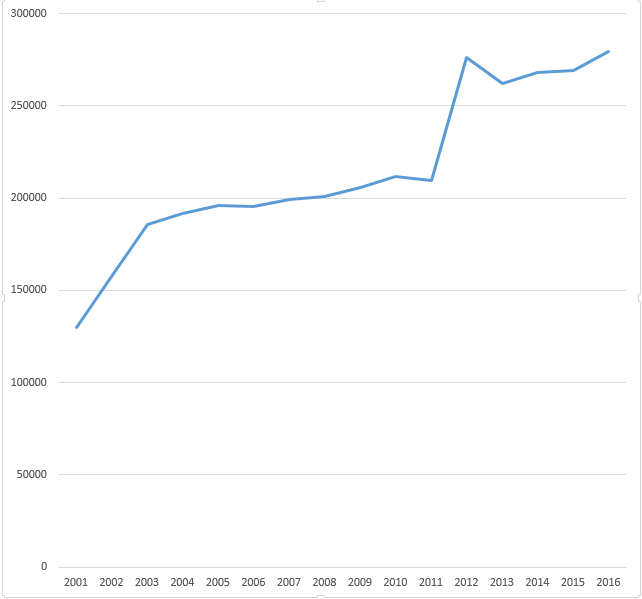 |
10 KB | Sebastian (talk | contribs) | National Institute on Minority Health and Health Disparities (NIMHD) congressional appropriations per year. In thousands of dollars. | 1 |
| 18:48, 3 April 2017 | NCCIH.png (file) | 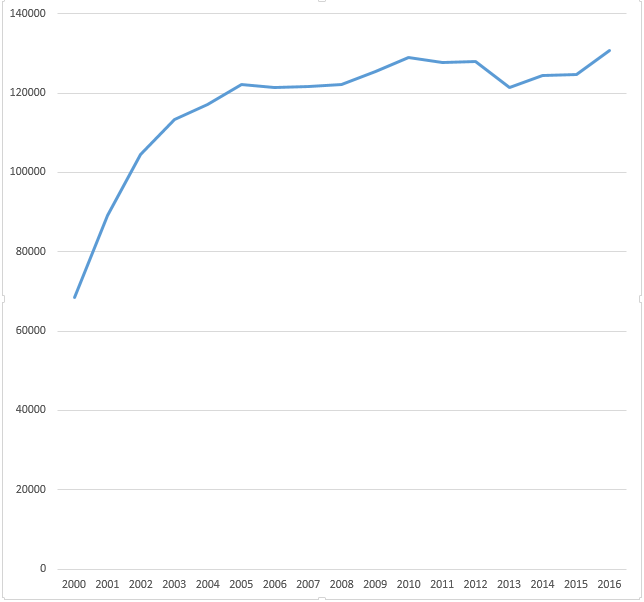 |
10 KB | Sebastian (talk | contribs) | National Center for Complementary and Integrative Health (NCCIH) congressional appropriations per year. In thousands of dollars. | 1 |
| 18:49, 3 April 2017 | NCATS.png (file) | 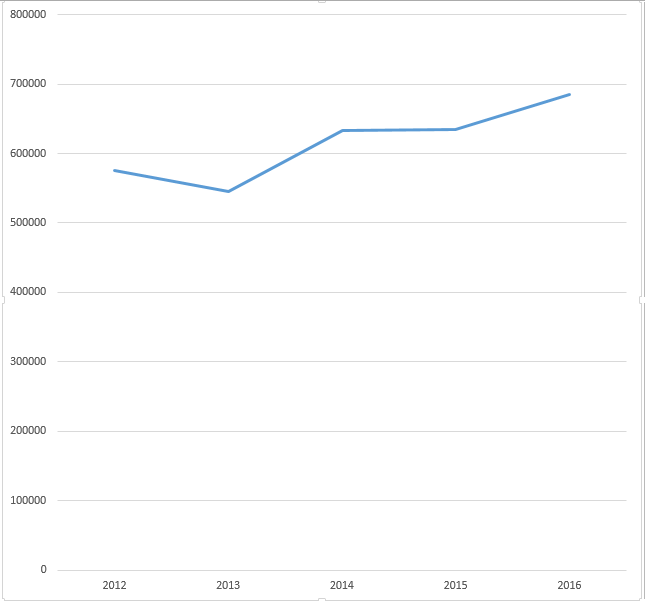 |
7 KB | Sebastian (talk | contribs) | National Center for Advancing Translational Sciences (NCATS) congressional appropriations per year. In thousands of dollars. | 1 |
| 18:50, 3 April 2017 | OD (NIH).png (file) | 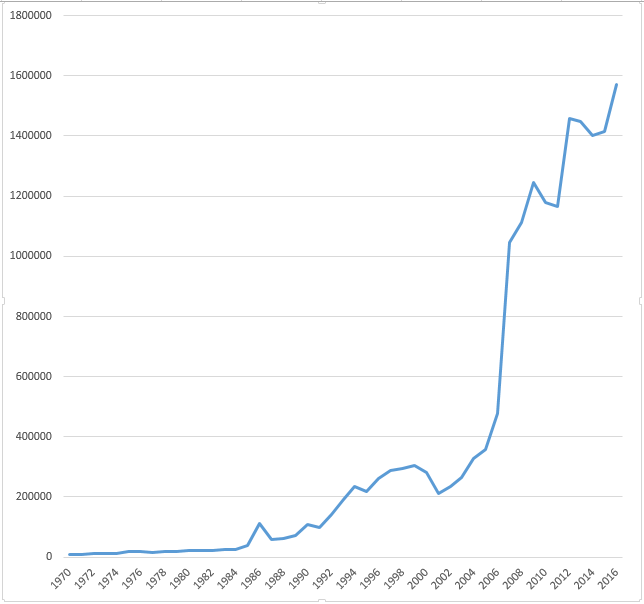 |
14 KB | Sebastian (talk | contribs) | NIH Office of the Director (OD) congressional appropriations per year. In thousands of dollars. | 1 |
| 18:53, 3 April 2017 | NIH total congressional appropriations per year. In millions of dollars. Non-logarithmic.png (file) | 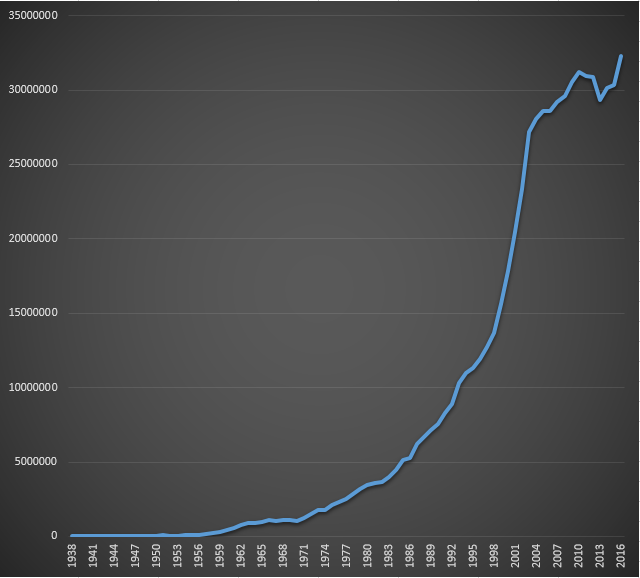 |
106 KB | Sebastian (talk | contribs) | National Institutes of Health total congressional appropriations per year. In thousands of dollars. Non-logarithmic. | 1 |
| 18:55, 3 April 2017 | NIH congressional appropriations per year. In thousands of dollars. Cumulative.png (file) | 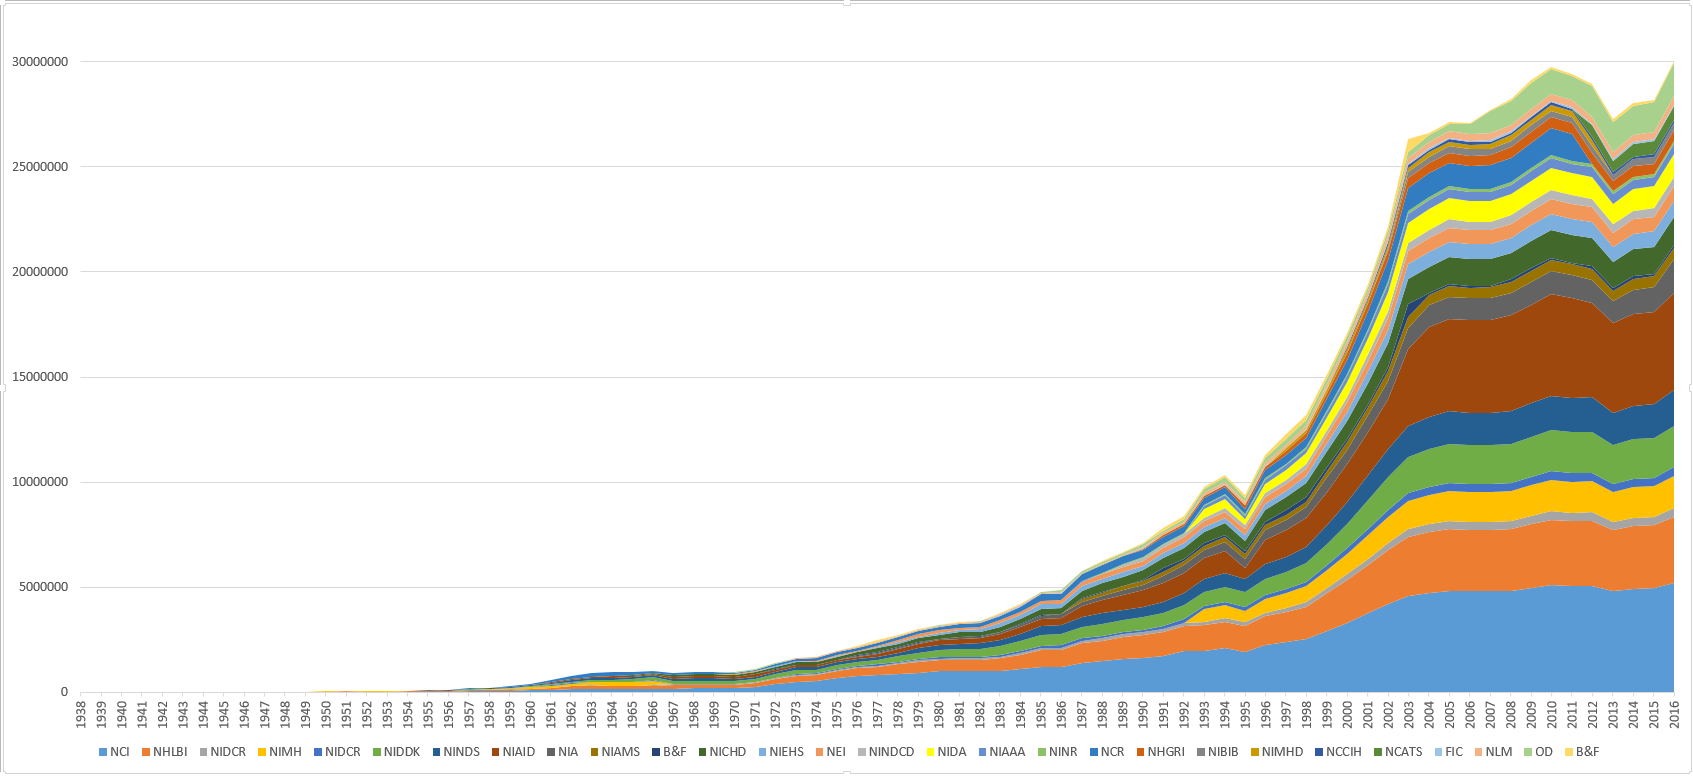 |
116 KB | Sebastian (talk | contribs) | National Institutes of Health (NIH) total congressional appropriations per year. Cumulative, in thousands of dollars. The National Cancer Institute (NCI) and the National Institute of Allergy and Infectious Diseases (NIAID) both stand out for their lar... | 1 |
| 19:06, 3 April 2017 | NCI.png (file) | 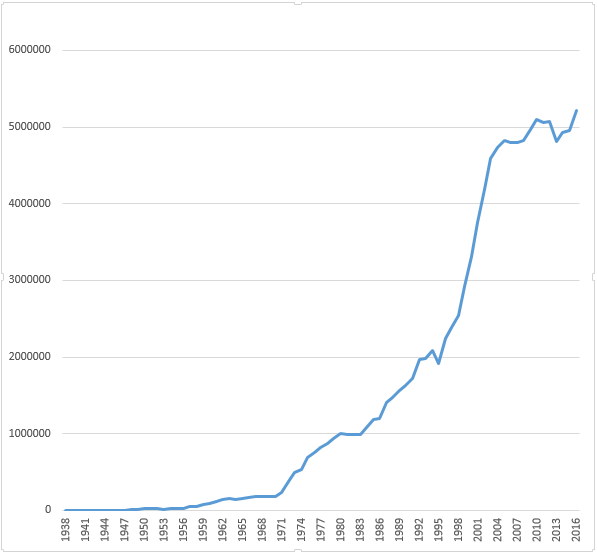 |
18 KB | Sebastian (talk | contribs) | 2 | |
| 22:08, 3 April 2017 | DNA sequencing costs in the Human Genome Project. Annual sequencing budget (in millions)..png (file) | 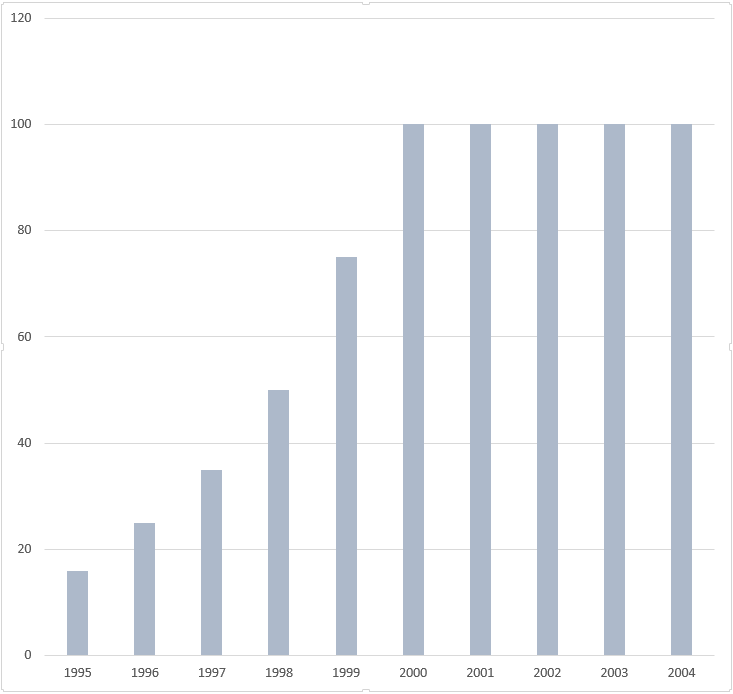 |
25 KB | Sebastian (talk | contribs) | DNA sequencing costs in the Human Genome Project. Annual sequencing budget (in millions). | 1 |
| 22:13, 3 April 2017 | DNA sequencing costs in the Human Genome Project. Genomic sequence (GB) per year.png (file) | 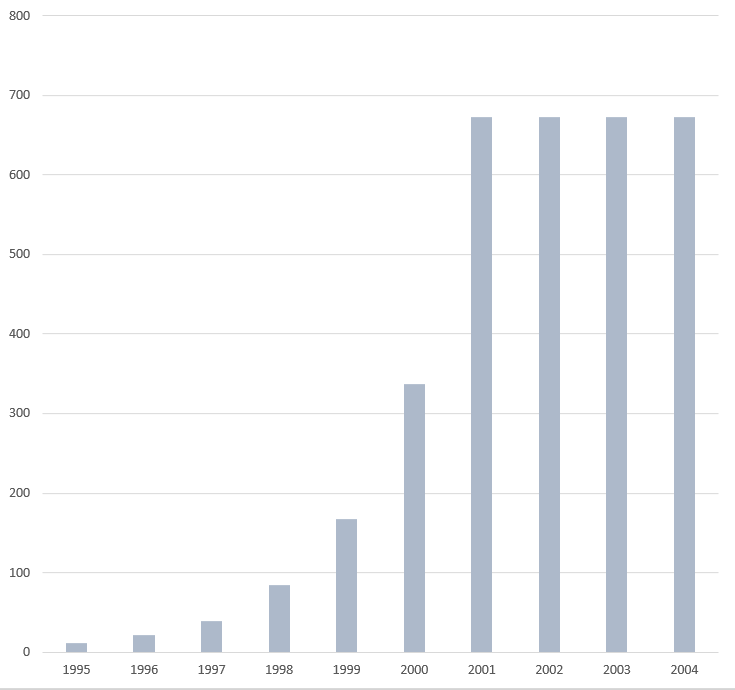 |
21 KB | Sebastian (talk | contribs) | DNA sequencing costs in the Human Genome Project. Genomic sequence (GB) per year. | 1 |
| 22:16, 3 April 2017 | DNA sequencing costs in the Human Genome Project. Finished, per-base direct cost.png (file) |  |
16 KB | Sebastian (talk | contribs) | DNA sequencing costs in the Human Genome Project. Finished, per-base direct cost. | 1 |
| 22:19, 3 April 2017 | DNA sequencing costs in the Human Genome Project. Genomic sequence (GB), cumulative.png (file) |  |
14 KB | Sebastian (talk | contribs) | DNA sequencing costs in the Human Genome Project. Genomic sequence (GB), cumulative. | 1 |
| 04:15, 4 April 2017 | DNA sequence analysis between 1967 and 1990. Relative speed (per unit of speed).png (file) | 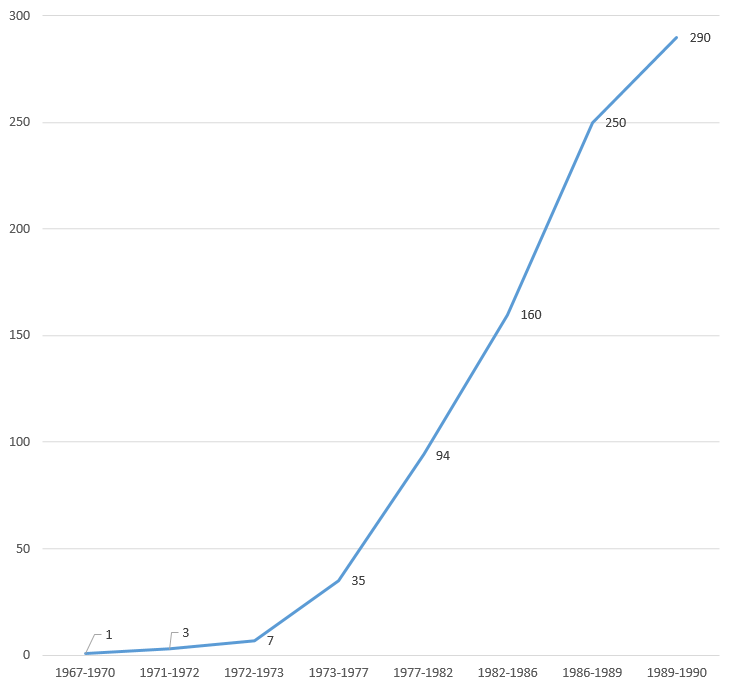 |
14 KB | Sebastian (talk | contribs) | DNA sequence analysis between 1967 and 1990. Relative speed (per unit of speed). | 1 |
| 04:20, 4 April 2017 | Nucleotides determined per time period between 1967 and 1990.png (file) | 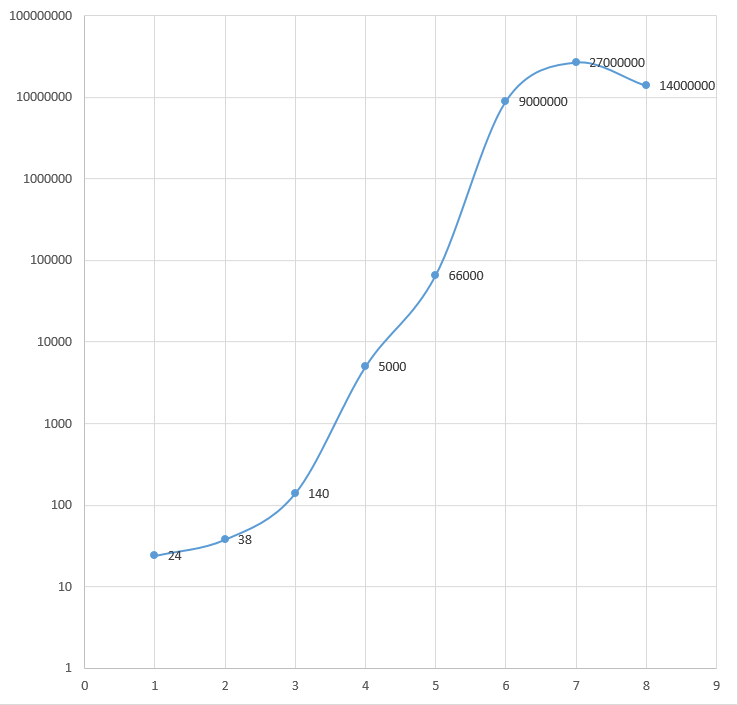 |
23 KB | Sebastian (talk | contribs) | 2 | |
| 04:24, 4 April 2017 | DNA sequence analysis between 1967 and 1990. Nucleotides per year, per investigator.png (file) | 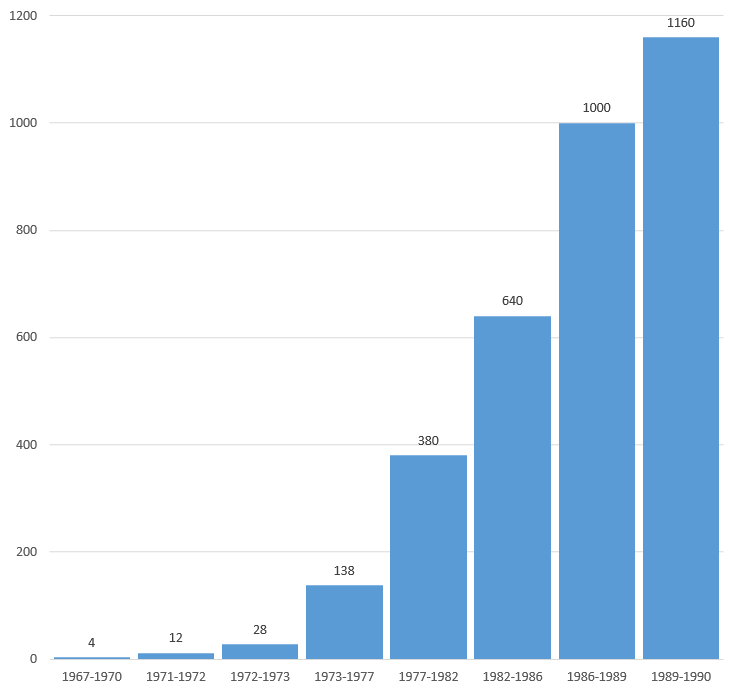 |
18 KB | Sebastian (talk | contribs) | 2 | |
| 04:26, 4 April 2017 | Number of investigators involved in DNA sequence analysis per time period between 1967 and 1990.png (file) | 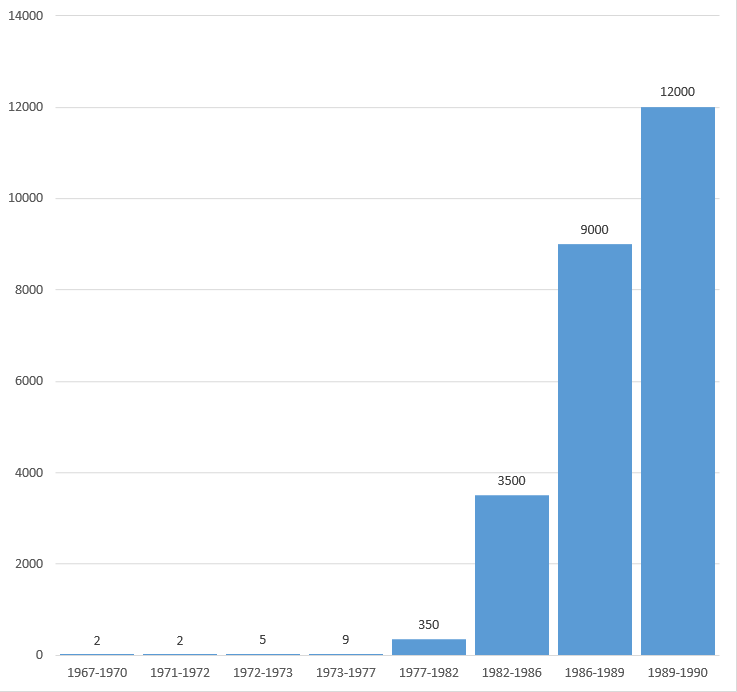 |
10 KB | Sebastian (talk | contribs) | 2 | |
| 18:24, 5 April 2017 | Number of confirmed typhoid-paratyphoid fever reported cases in European countries in the years 2008-2012.png (file) | 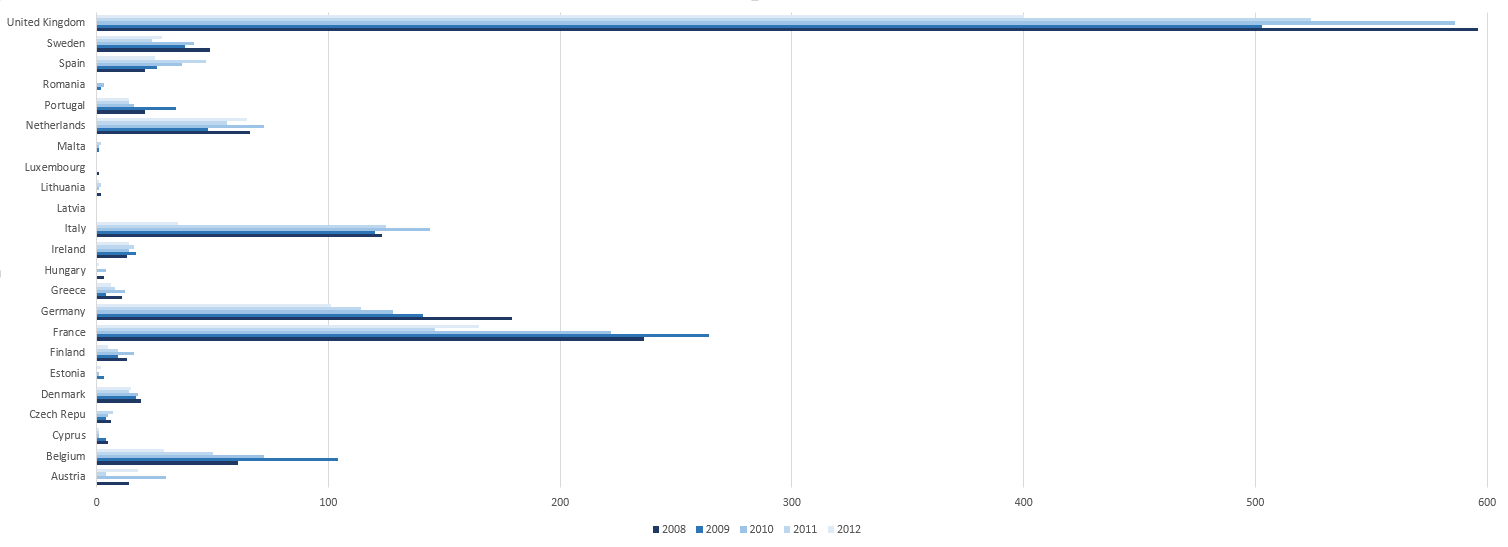 |
27 KB | Sebastian (talk | contribs) | Number of confirmed typhoid-paratyphoid fever reported cases in European countries in the years 2008-2012 | 1 |
| 18:27, 5 April 2017 | Number of cases and deaths due to typhoid fever, by outbreak.png (file) | 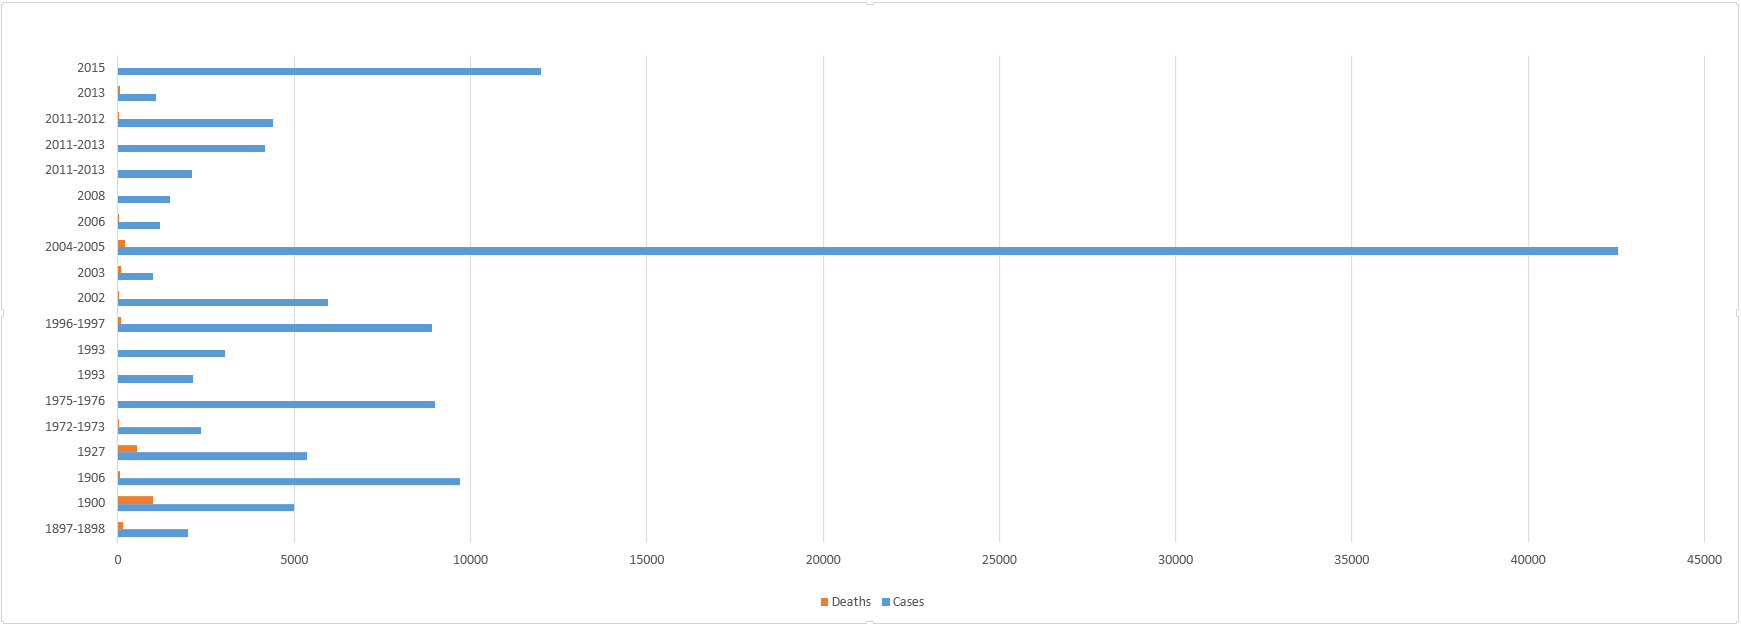 |
41 KB | Sebastian (talk | contribs) | Number of cases and deaths due to typhoid fever, by outbreak. | 1 |
| 18:57, 14 April 2017 | Mosquito net distribution in countries from African WHO region. Period 2013-2015..png (file) |  |
30 KB | Sebastian (talk | contribs) | Mosquito net distribution in countries from African WHO region. Period 2013-2015. | 1 |
| 19:22, 14 April 2017 | Mosquito net distribution in countries from African WHO region. Period 2013-2015. Table 2..png (file) | 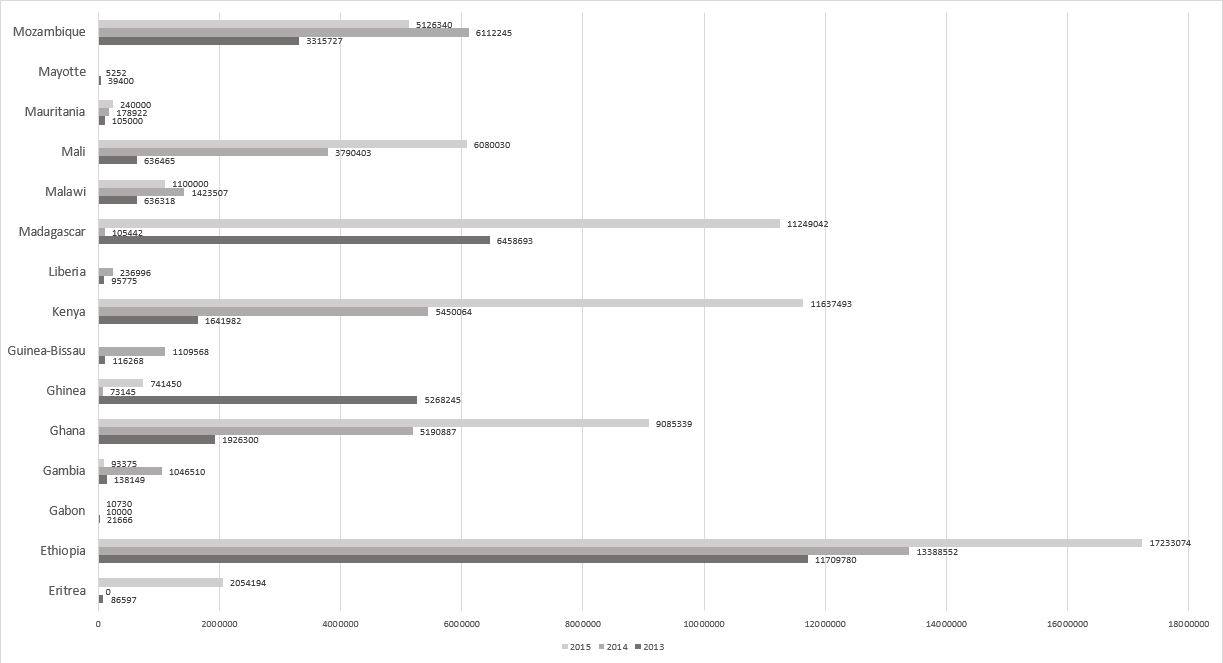 |
32 KB | Sebastian (talk | contribs) | Mosquito net distribution in countries from African WHO region. Period 2013-2015. Table 2. | 1 |
| 19:29, 14 April 2017 | Mosquito net distribution in countries from African WHO region. Period 2013-2015. Table 3.png (file) |  |
26 KB | Sebastian (talk | contribs) | Mosquito net distribution in countries from African WHO region. Period 2013-2015. Table 3. | 1 |
| 19:42, 14 April 2017 | Mosquito net distribution in countries belonging to Americas, European and Eastern Mediterranean WHO regions. Period 2013-2015.png (file) | 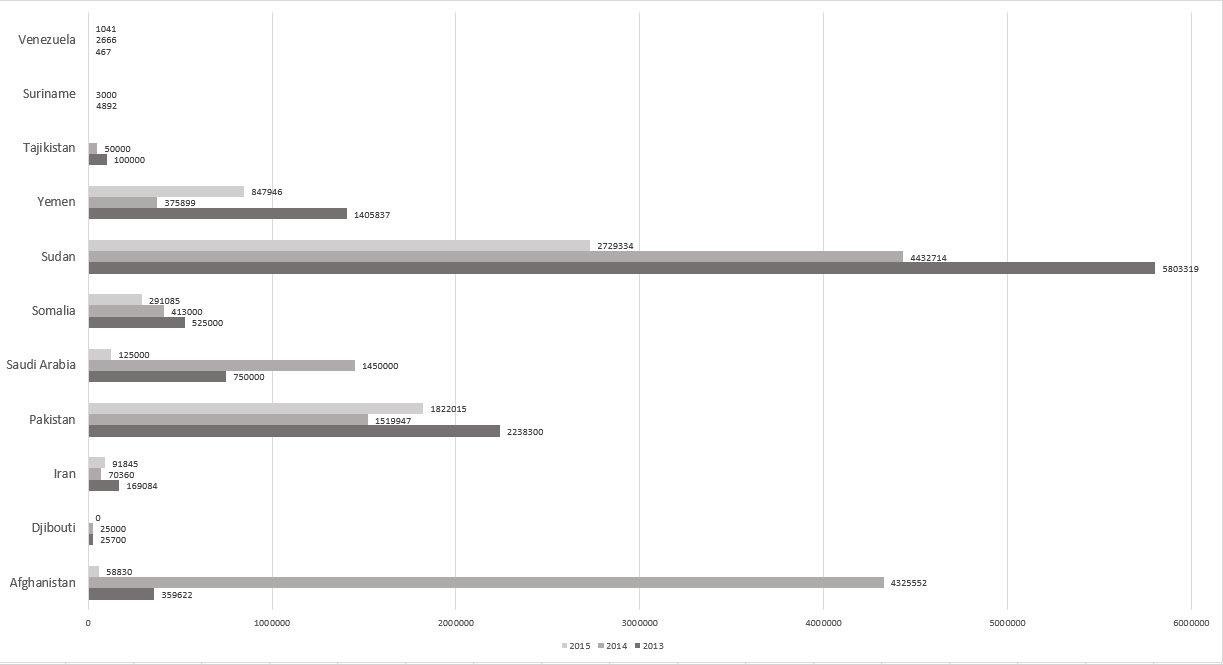 |
26 KB | Sebastian (talk | contribs) | Mosquito net distribution in countries belonging to Americas, European and Eastern Mediterranean WHO regions. Period 2013-2015. | 1 |
| 19:43, 14 April 2017 | Mosquito net distribution in countries from South East Asia WHO region. Period 2013-2015.png (file) | 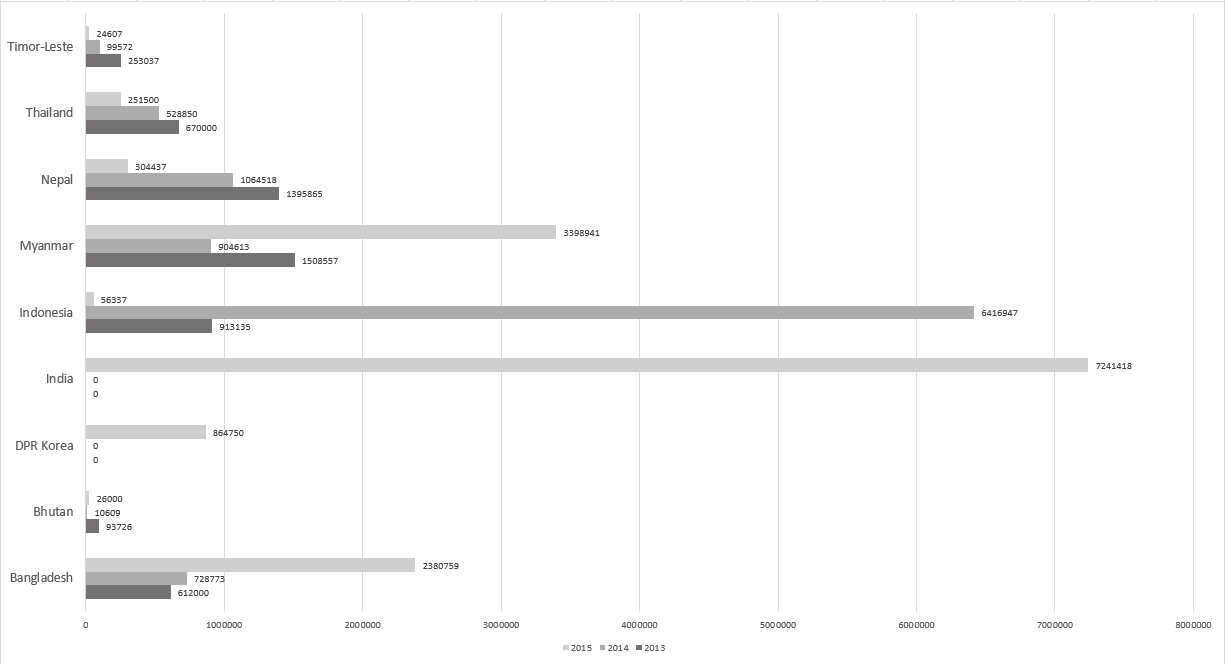 |
25 KB | Sebastian (talk | contribs) | Mosquito net distribution in countries from South East Asia WHO region. Period 2013-2015. | 1 |
| 19:44, 14 April 2017 | Mosquito net distribution in countries from Western Pacific WHO region. Period 2013-2015.png (file) | 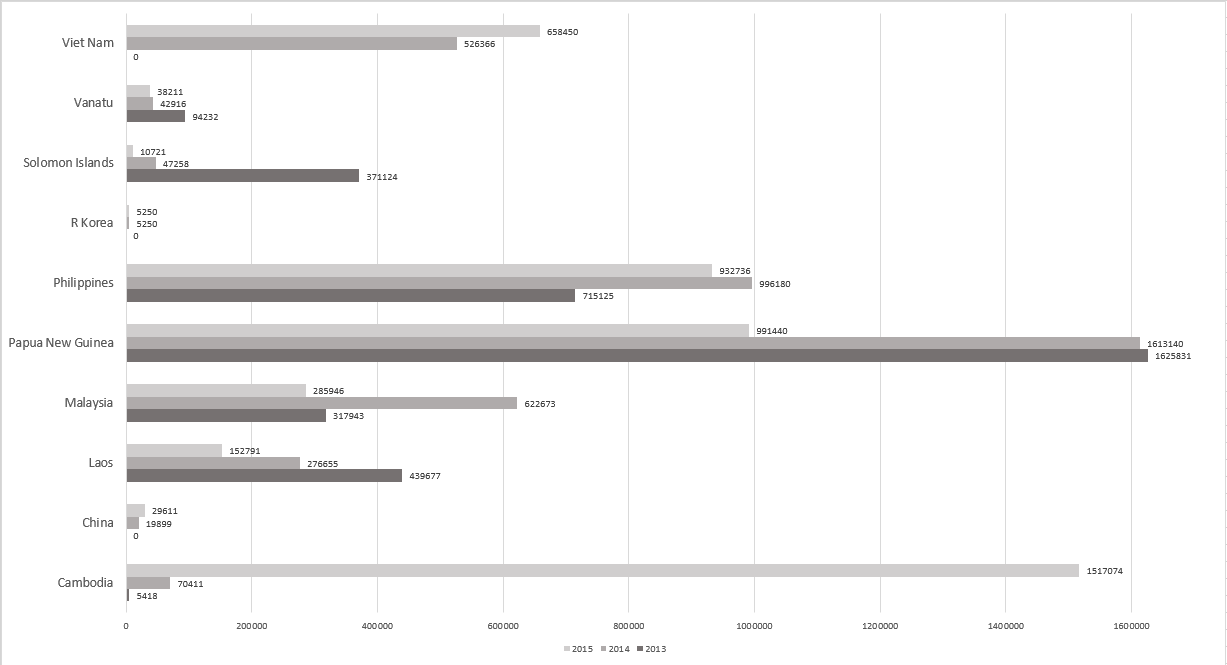 |
26 KB | Sebastian (talk | contribs) | Mosquito net distribution in countries from Western Pacific WHO region. Period 2013-2015. | 1 |
| 19:53, 14 April 2017 | Mosquito net distribution in countries belonging to African WHO region. Period 2013-2015. Cumulative.png (file) | 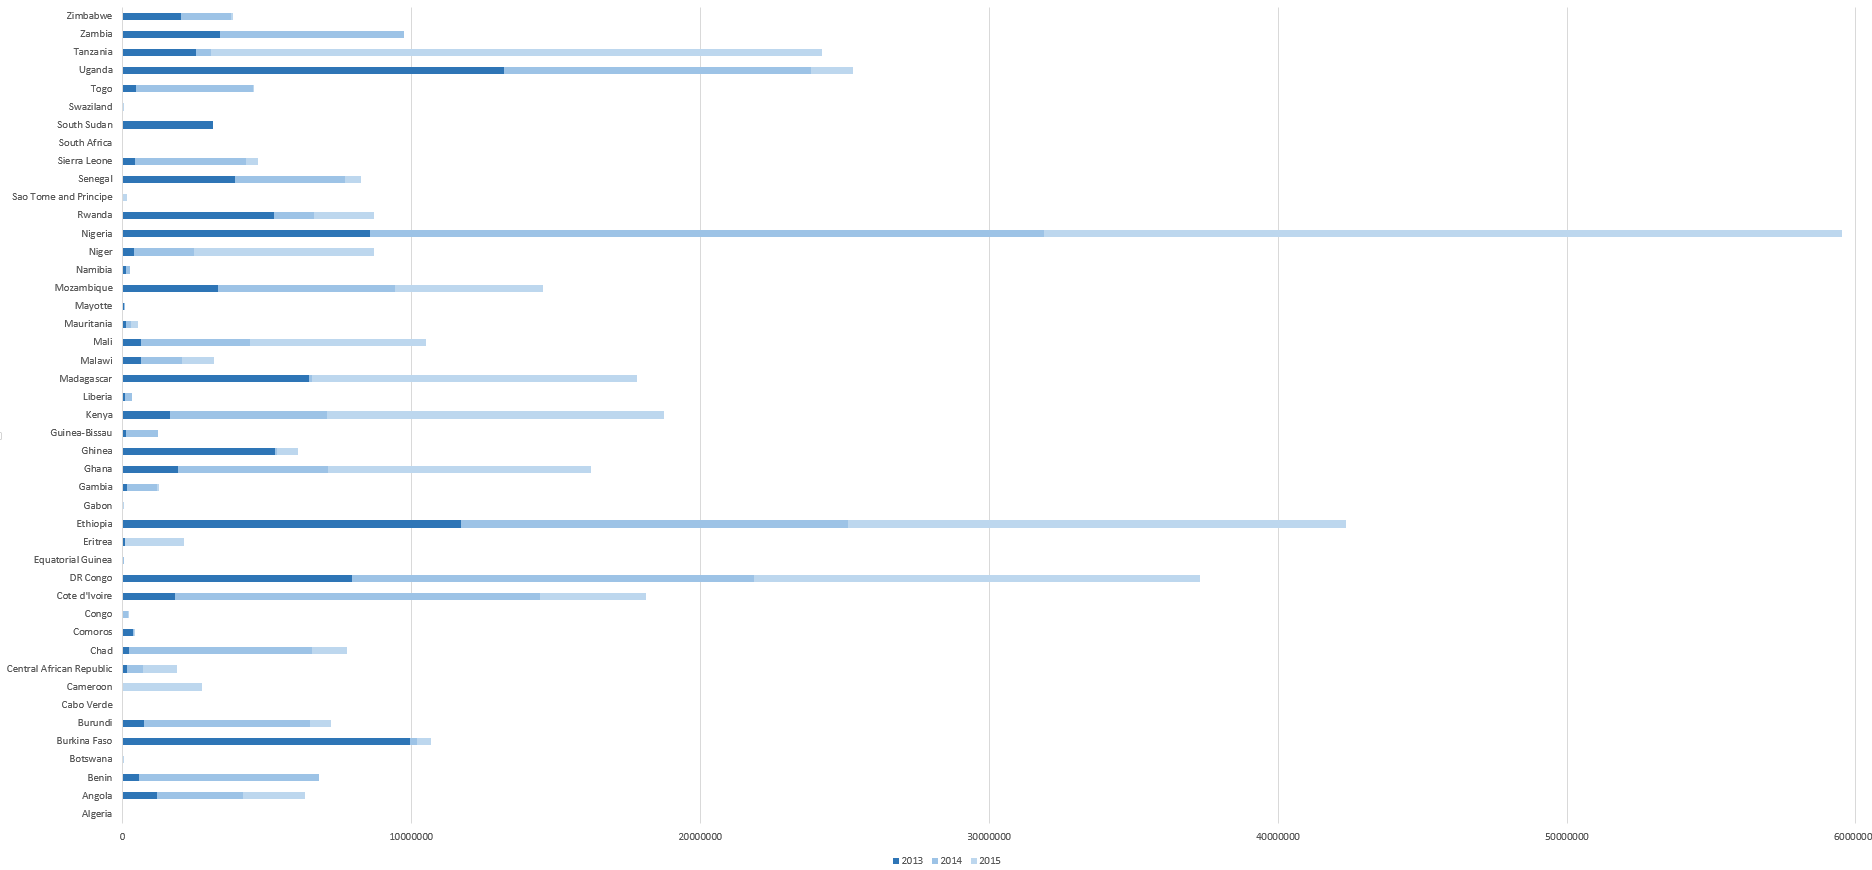 |
35 KB | Sebastian (talk | contribs) | Mosquito net distribution in countries belonging to African WHO region. Period 2013-2015. Cumulative. | 1 |
| 19:55, 14 April 2017 | Mosquito net distribution in countries belonging to Americas, European and Eastern Mediterranean WHO regions. Period 2013-2015. Cumulative.png (file) | 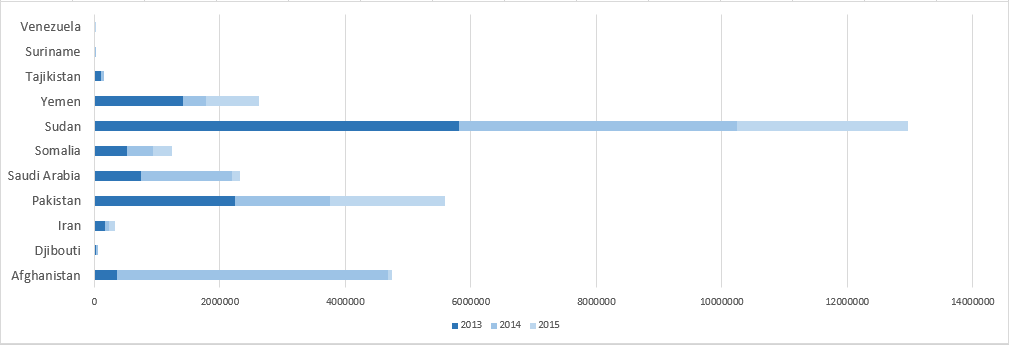 |
12 KB | Sebastian (talk | contribs) | Mosquito net distribution in countries belonging to Americas, European and Eastern Mediterranean WHO regions. Period 2013-2015. Cumulative. | 1 |
| 20:01, 14 April 2017 | Mosquito net distribution in countries belonging to South East Asia WHO region. Period 2013-2015. Cumulative.png (file) |  |
11 KB | Sebastian (talk | contribs) | Mosquito net distribution in countries belonging to South East Asia WHO region. Period 2013-2015. Cumulative. | 1 |
| 20:04, 14 April 2017 | Mosquito net distribution in countries belonging to Western Pacific WHO region. Period 2013-2015. Cumulative.png (file) | 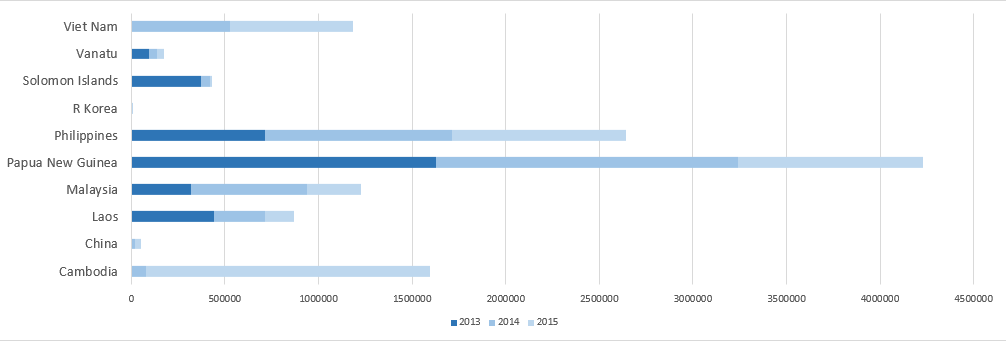 |
14 KB | Sebastian (talk | contribs) | Mosquito net distribution in countries belonging to Western Pacific WHO region. Period 2013-2015. Cumulative. | 1 |