File list
Jump to navigation
Jump to search
This special page shows all uploaded files.

| Date | Name | Thumbnail | Size | User | Description | Versions |
|---|---|---|---|---|---|---|
| 04:07, 19 October 2026 | Integrated-information-theory-google-trends.jpeg (file) |  |
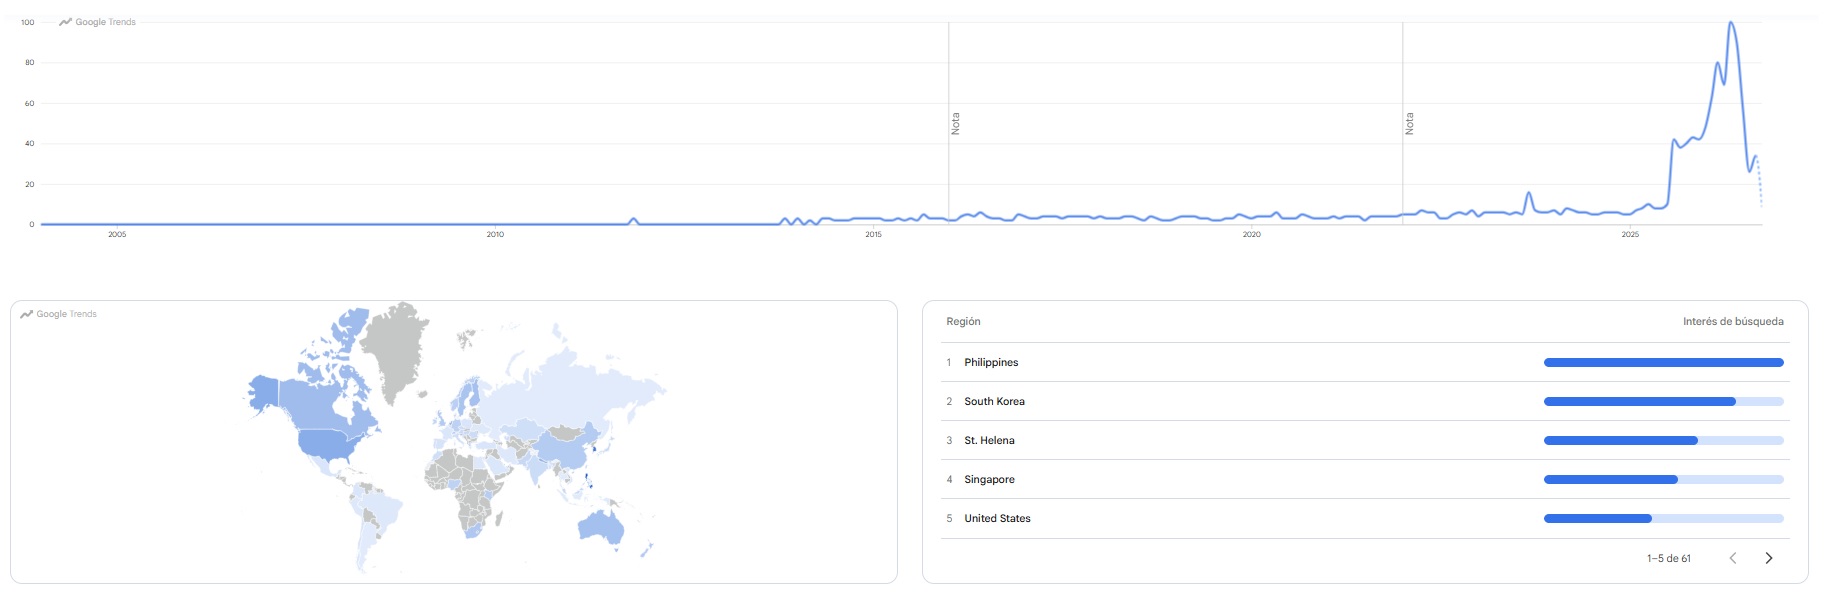
104 KB | Sebastian (talk | contribs) | The chart shows worldwide Google Trends data for the search term "Integrated information theory" from January 2004 to October 2026.<ref>{{cite web |title=Integrated information theory |url=https://trends.google.es/explore?q=Integrated%20information%20theory&date=all&geo=Worldwide |website=Google Trends |access-date=2026-10-19}}</ref> Values are relative, with 100 marking the month of peak search interest. Interest is negligible until the early 2010s, then holds at a low but steady level of ab... | 1 |
| 03:39, 19 October 2026 | Integrated-information-theory-wikipedia-views.jpg (file) |  |
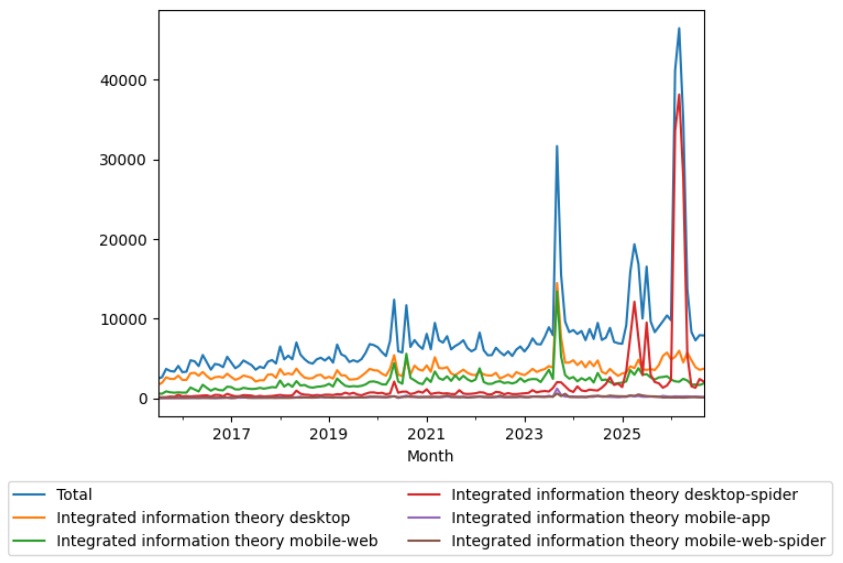
76 KB | Sebastian (talk | contribs) | The chart shows Wikipedia pageviews for the article {{w|Integrated information theory}} on desktop, mobile-web, desktop-spider, mobile-web-spider and mobile app, from July 2015 to September 2026.<ref>{{cite web |title=Integrated information theory |url=https://wikipediaviews.org/displayviewsformultiplemonths.php?page=Integrated+information+theory&allmonths=allmonths-api&language=en&drilldown=all |website=wikipediaviews.org |access-date=2026-10-19}}</ref> Views rise gradually from about 3,000... | 1 |
| 20:05, 10 October 2026 | Corrigibility-google-trends.jpg (file) |  |
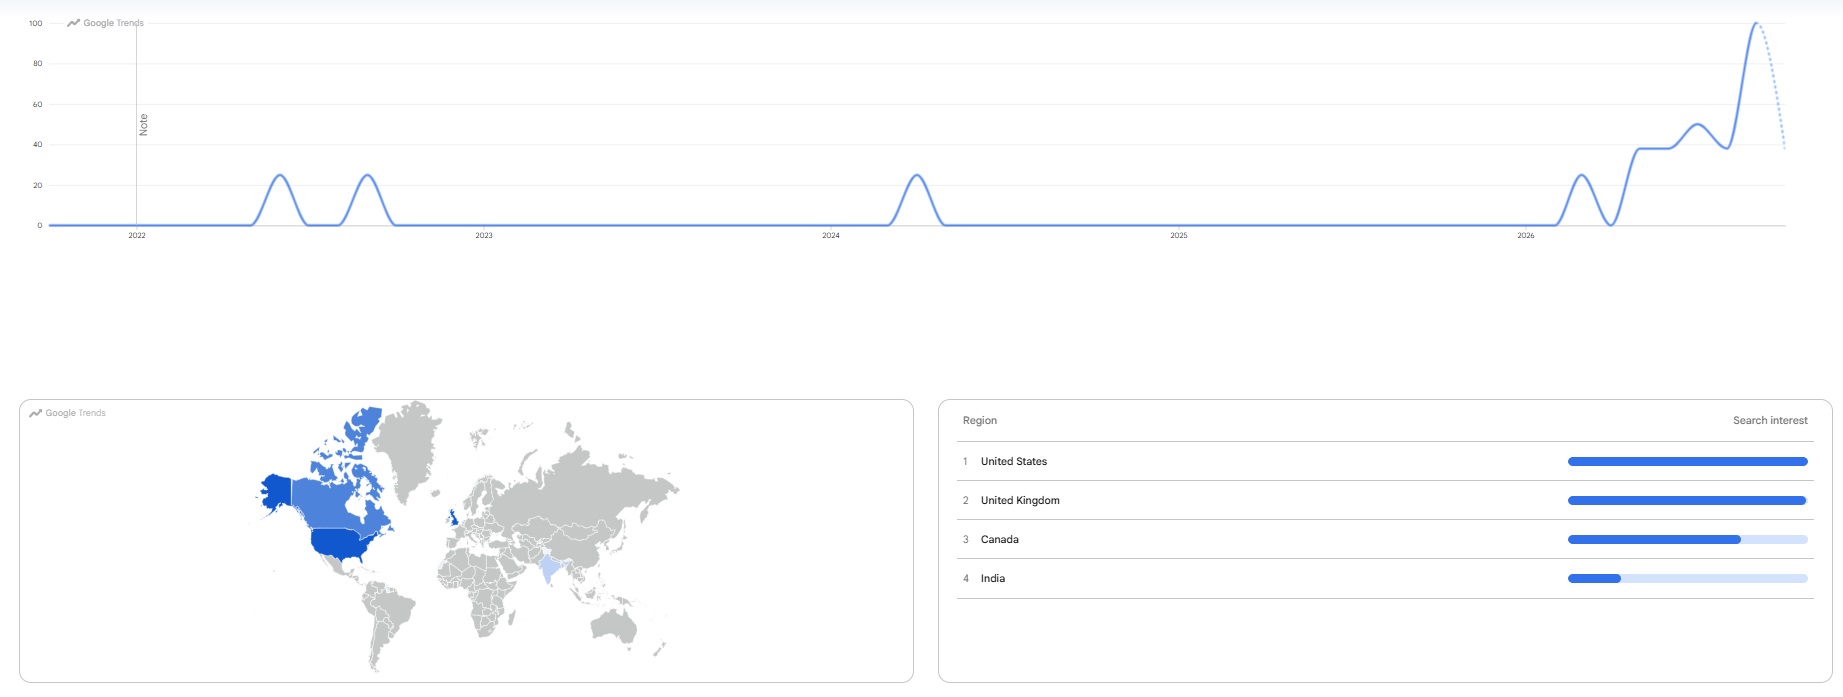
102 KB | Sebastian (talk | contribs) | The chart shows worldwide Google Trends interest in the topic of AI capability control over the past five years, scaled so that 100 marks peak interest. Interest stays near zero apart from brief spikes in 2022, 2024, and early 2026, then climbs through mid-2026 to a peak around September. The United States leads, followed by the United Kingdom, Canada, and India.<ref>{{cite web |title=Google Trends: AI capability control, worldwide, past 5 years |url=https://trends.google.es/explore?q=%2Fg%2F... | 1 |
| 19:03, 10 October 2026 | Ai-capability-control-wikipedia-views.jpg (file) |  |
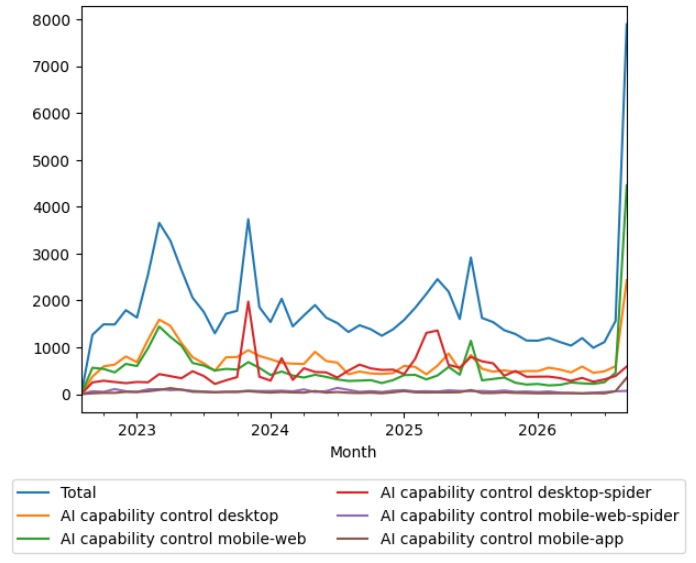
69 KB | Sebastian (talk | contribs) | The chart shows monthly Wikipedia pageviews for the article "AI capability control" from August 2022 to September 2026, split by desktop, mobile web, mobile app, and spider traffic. Total views mostly range between 1,000 and 2,000 a month, with peaks of about 3,700 in early and late 2023 and 2,900 in mid-2025, before jumping to nearly 8,000 in the latest month.<ref>{{cite web |title=AI capability control: monthly pageviews, August 2022 to September 2026 |url=https://wikipediaviews.org/display... | 1 |
| 15:21, 13 September 2026 | Collective-farming-google-ngram.jpg (file) |  |
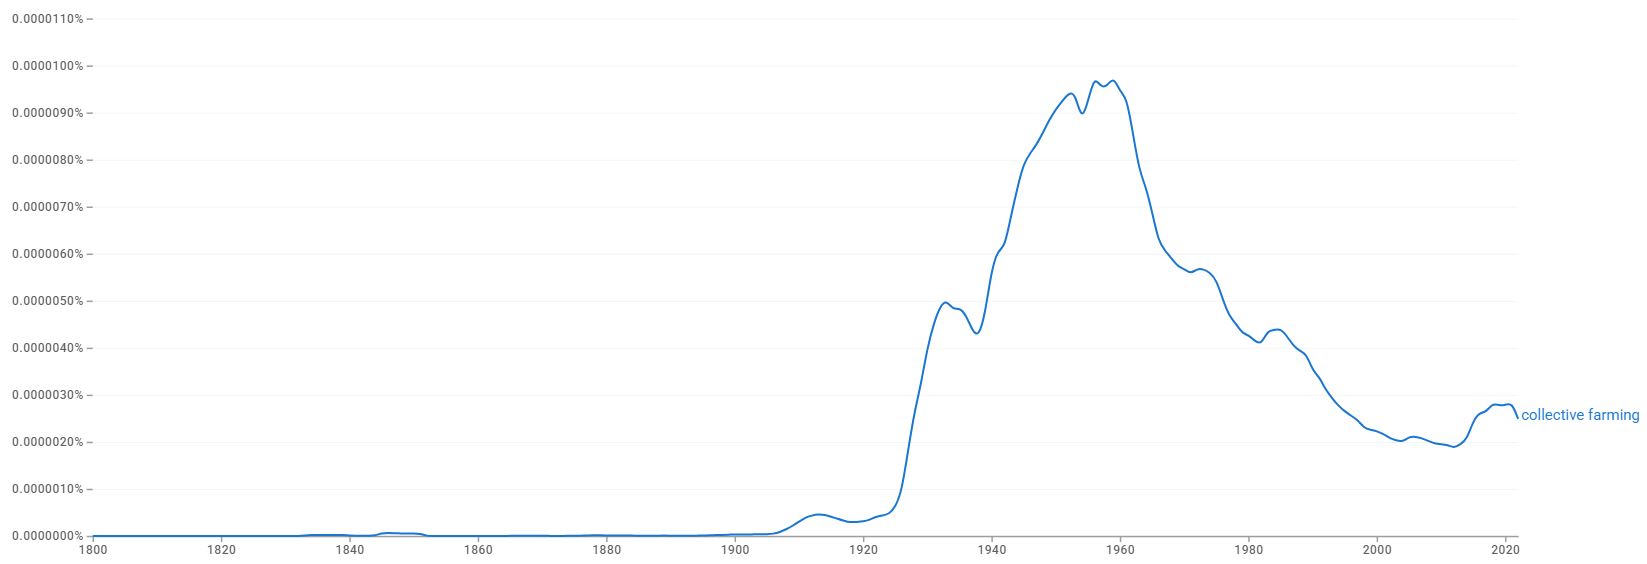
47 KB | Sebastian (talk | contribs) | The chart shows the frequency of the phrase "collective farming" in English-language books from 1800 to 2022.<ref name="ngram-collectivefarming">{{cite web |title=Google Ngram Viewer: collective farming (1800–2022, English corpus) |publisher=Google |url=https://books.google.com/ngrams/graph?content=collective+farming&year_start=1800&year_end=2022&corpus=en&smoothing=3 |access-date=2026-09-13}}</ref> The term is essentially absent from English-language print before 1900, begins rising gradual... | 1 |
| 15:07, 13 September 2026 | Collective-farming-google-trends.jpg (file) |  |
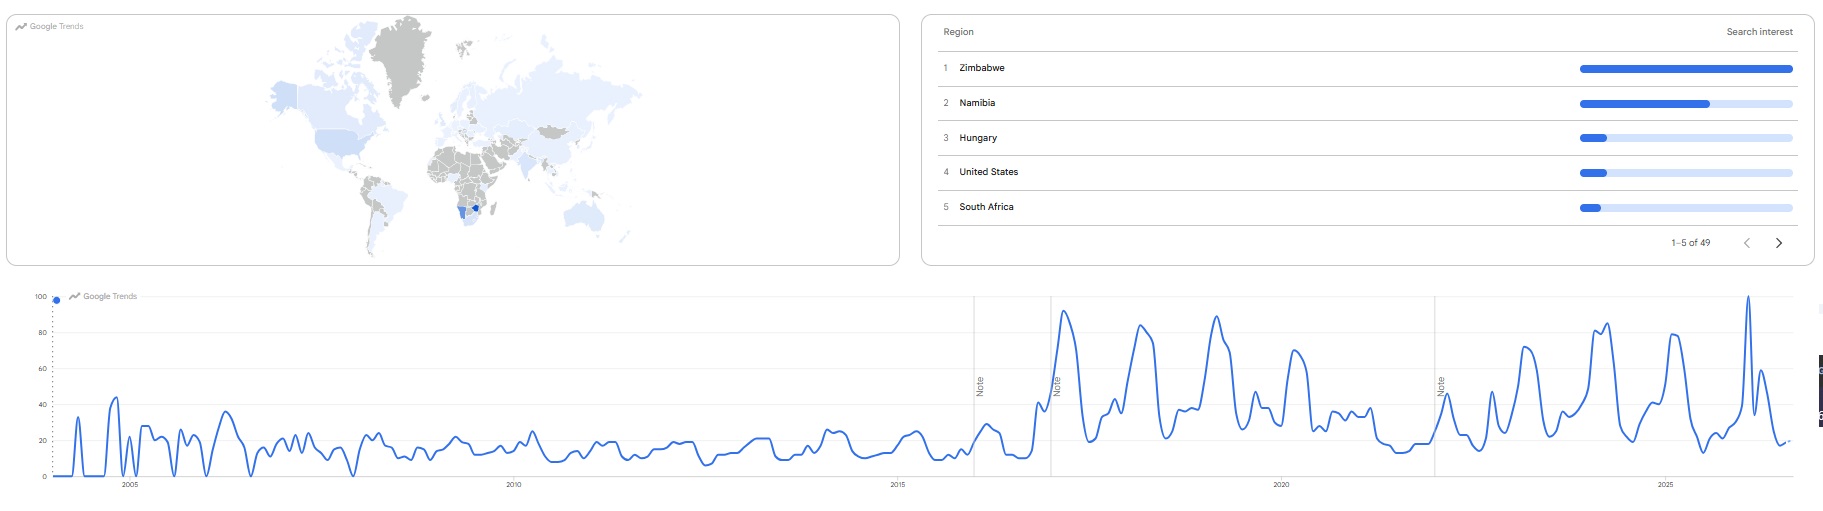
116 KB | Sebastian (talk | contribs) | The chart shows worldwide Google search interest in the topic "Collective farming" from 2004 to the present, indexed to a peak value of 100.<ref name="googletrends-collectivefarming">{{cite web |title=Google Trends: Collective farming (worldwide, 2004–present) |publisher=Google |url=https://trends.google.es/explore?q=%2Fm%2F0p388&date=all&geo=Worldwide&hl=en-US |access-date=2026-09-13}}</ref> Search interest shows a strong, recurring annual seasonal pattern across the entire period, with sha... | 1 |
| 15:01, 13 September 2026 | Collective-farming-wikipedia-views.jpg (file) |  |
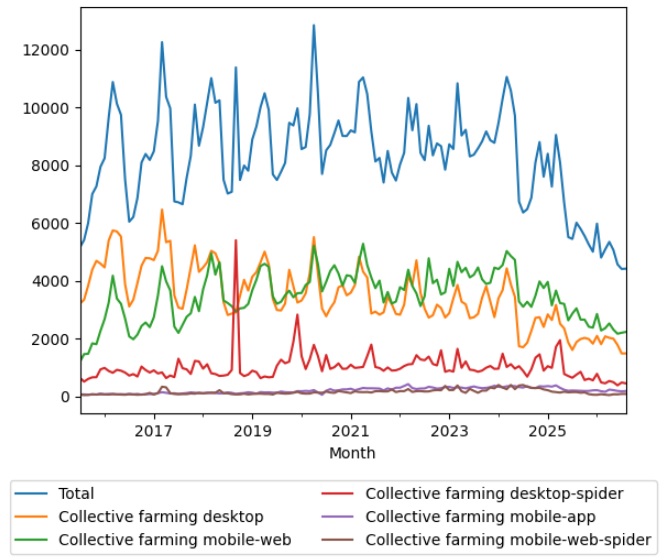
94 KB | Sebastian (talk | contribs) | The chart shows monthly pageviews for the English Wikipedia article "Collective farming" from July 2015 to the present, broken down by access method (desktop, mobile web, and spider/bot traffic for each).<ref name="wikipediaviews-collectivefarming">{{cite web |title=Wikipedia Views: Collective farming |publisher=wikipediaviews.org |url=https://wikipediaviews.org/displayviewsformultiplemonths.php?page=Collective+farming&allmonths=allmonths-api&language=en&drilldown=all |access-date=2026-09-13}... | 1 |
| 19:00, 5 September 2026 | Experiment-design-wikipedia-views-2026.jpg (file) |  |
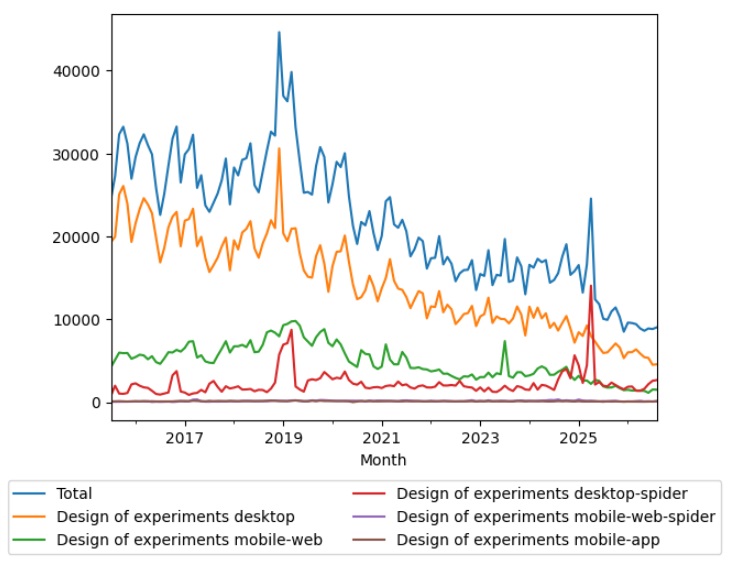
89 KB | Sebastian (talk | contribs) | The chart shows pageviews of the English Wikipedia article {{w|Design of experiments}}, from July 2015 to August 2026.<ref>{{cite web |title=Design of experiments |url=https://wikipediaviews.org/displayviewsformultiplemonths.php?page=Design+of+experiments&allmonths=allmonths-api&language=en&drilldown=all |website=wikipediaviews.org |access-date=5 September 2026}}</ref> | 1 |
| 17:15, 5 September 2026 | Experiment-design-google-trends-2026.jpg (file) |  |
89 KB | Sebastian (talk | contribs) | The chart shows {{w|Google Trends}} data for Design of experiments (Topic), from January 2004 to September 2026, when the screenshot was taken. Interest is also ranked by country and displayed on world map. Search interest declines sharply from its 2004 peak through the mid-2000s, then levels off into a noisy but roughly stable plateau for nearly two decades, with a modest uptick in the final year of data shown.<ref>{{cite web |title=Design of experiments |url=https://trends.google.es/trends/... | 1 |
| 23:22, 5 August 2026 | Grok-wikipedia-views.JPG (file) |  |
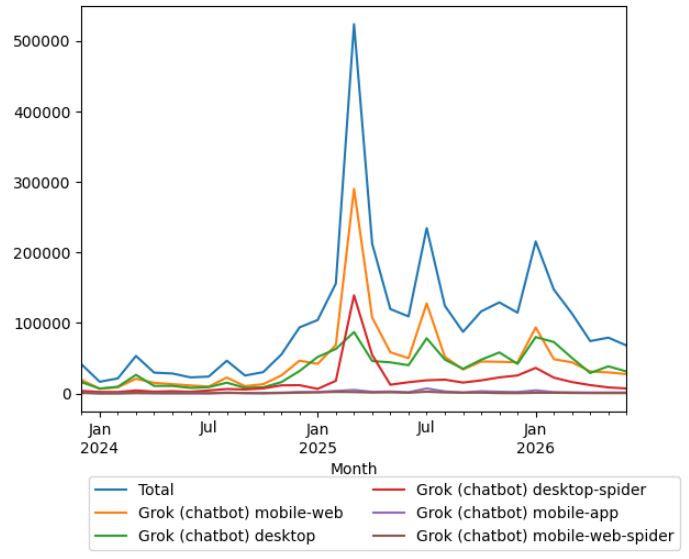
42 KB | Sebastian (talk | contribs) | The graph shows monthly pageview data for the English Wikipedia article "Grok (chatbot)," as observed on 5 August 2026. Traffic remains minimal and near-flat through 2024, before a sharp spike to an all-time peak of over 500,000 views around January 2025, coinciding with the Grok 3 release and its associated benchmark-manipulation controversy. Traffic falls sharply afterward but remains substantially elevated relative to the 2024 baseline, with recurring secondary peaks around mid-2025 and ea... | 1 |
| 23:05, 5 August 2026 | Grok-google-trends.jpg (file) |  |
70 KB | Sebastian (talk | contribs) | Google Trends data for global search interest in "Grok" (using the disambiguated Knowledge Graph topic, avoiding conflation with the unrelated verb "to grok") shows search volume remaining minimal and flat through 2023 and most of 2024, before a sharp single-week spike to its all-time peak around March 2025, coinciding with the Grok 3 release and its associated benchmark controversy. Interest partially recedes afterward but resumes a steady overall upward trend through 2025 and into 2026, pun... | 1 |
| 14:41, 2 August 2026 | Mistral-wikipediaviews.JPG (file) |  |
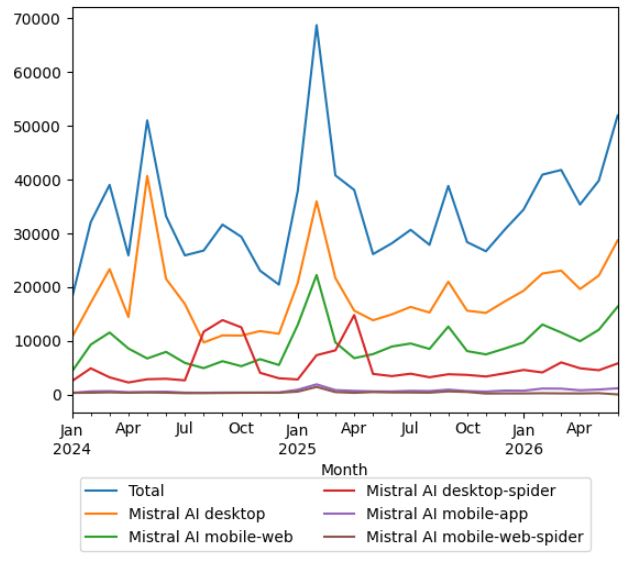
48 KB | Sebastian (talk | contribs) | The chart shows monthly pageviews for the English Wikipedia article on Mistral AI, broken down by total and by access type (desktop, desktop-spider, mobile web, mobile web-spider, and mobile app), from January 2024 to June 2026. Total views show a general upward trend with pronounced spikes and considerable volatility: they begin at moderate levels in early 2024, reach a first marked peak in April 2024, then a larger peak of nearly 70,000 views in January 2025 (coinciding with the launch of L... | 1 |
| 14:30, 2 August 2026 | Mistralai-google-trends.png (file) |  |
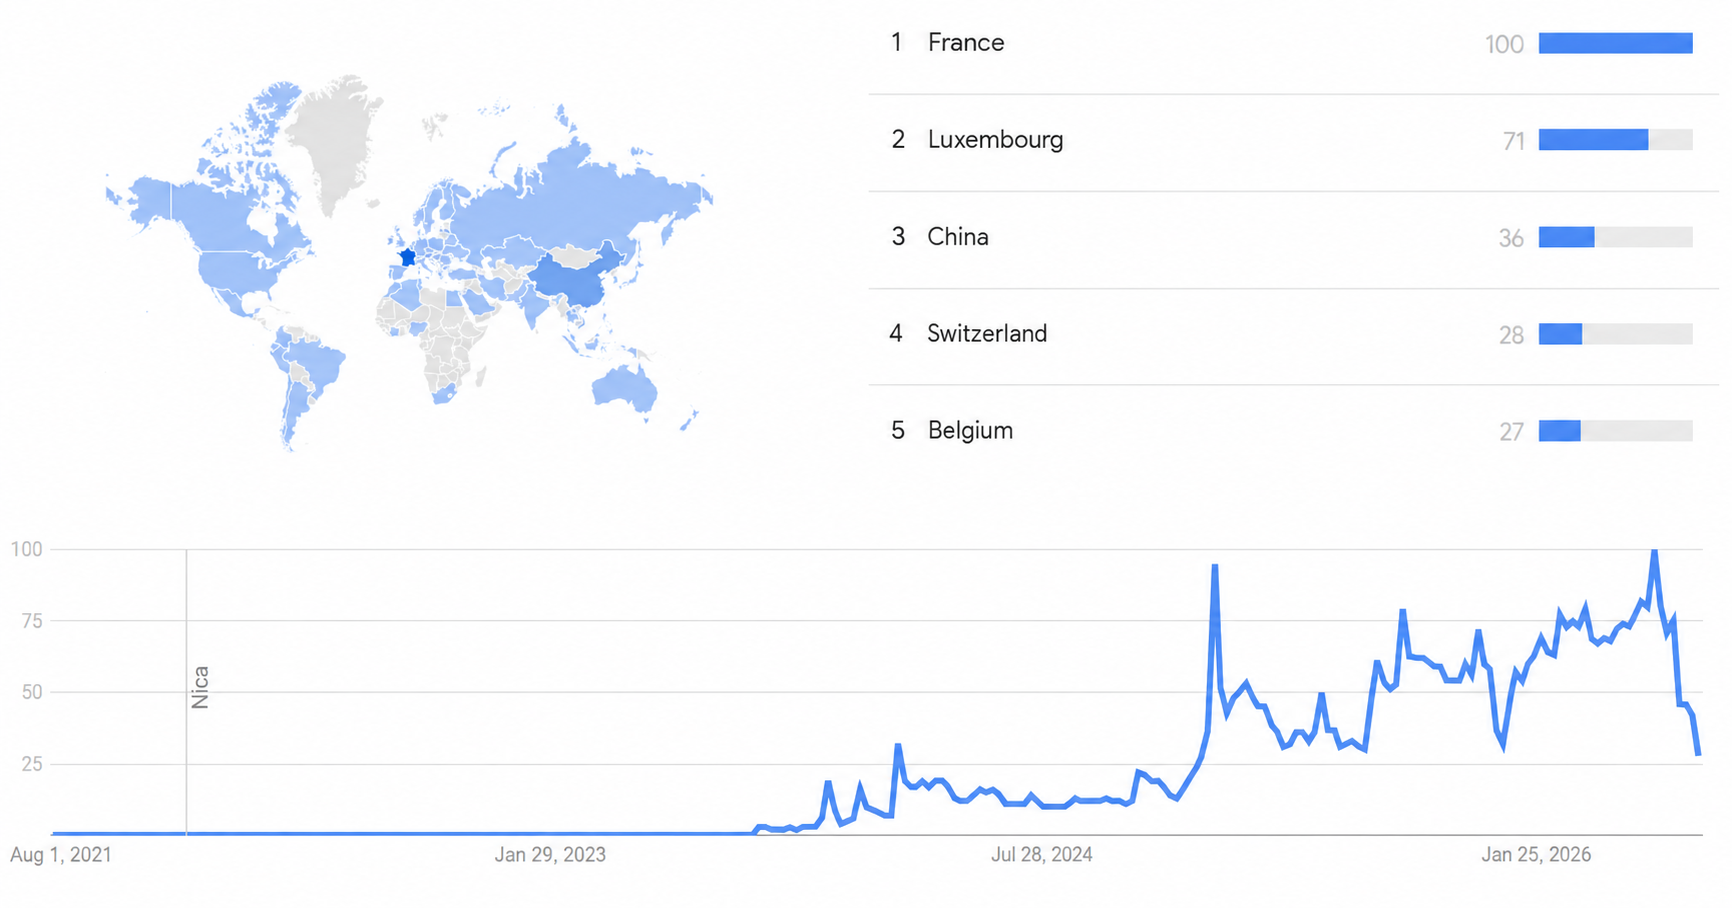
890 KB | Sebastian (talk | contribs) | The chart shows worldwide Google Trends search interest for the topic "Mistral AI" over the past five years (roughly August 2021 to the present), with an annotation marker around January 2023. Search interest is negligible until mid-2023, rises gradually through 2024, spikes sharply around mid-2025 (coinciding with the company's Series C funding round and rapid partnership announcements), and remains elevated with continued volatility through early 2026. By region, interest is highest in Fran... | 1 |
| 03:05, 30 July 2026 | Laboratory-leak-google-trends.png (file) |  |
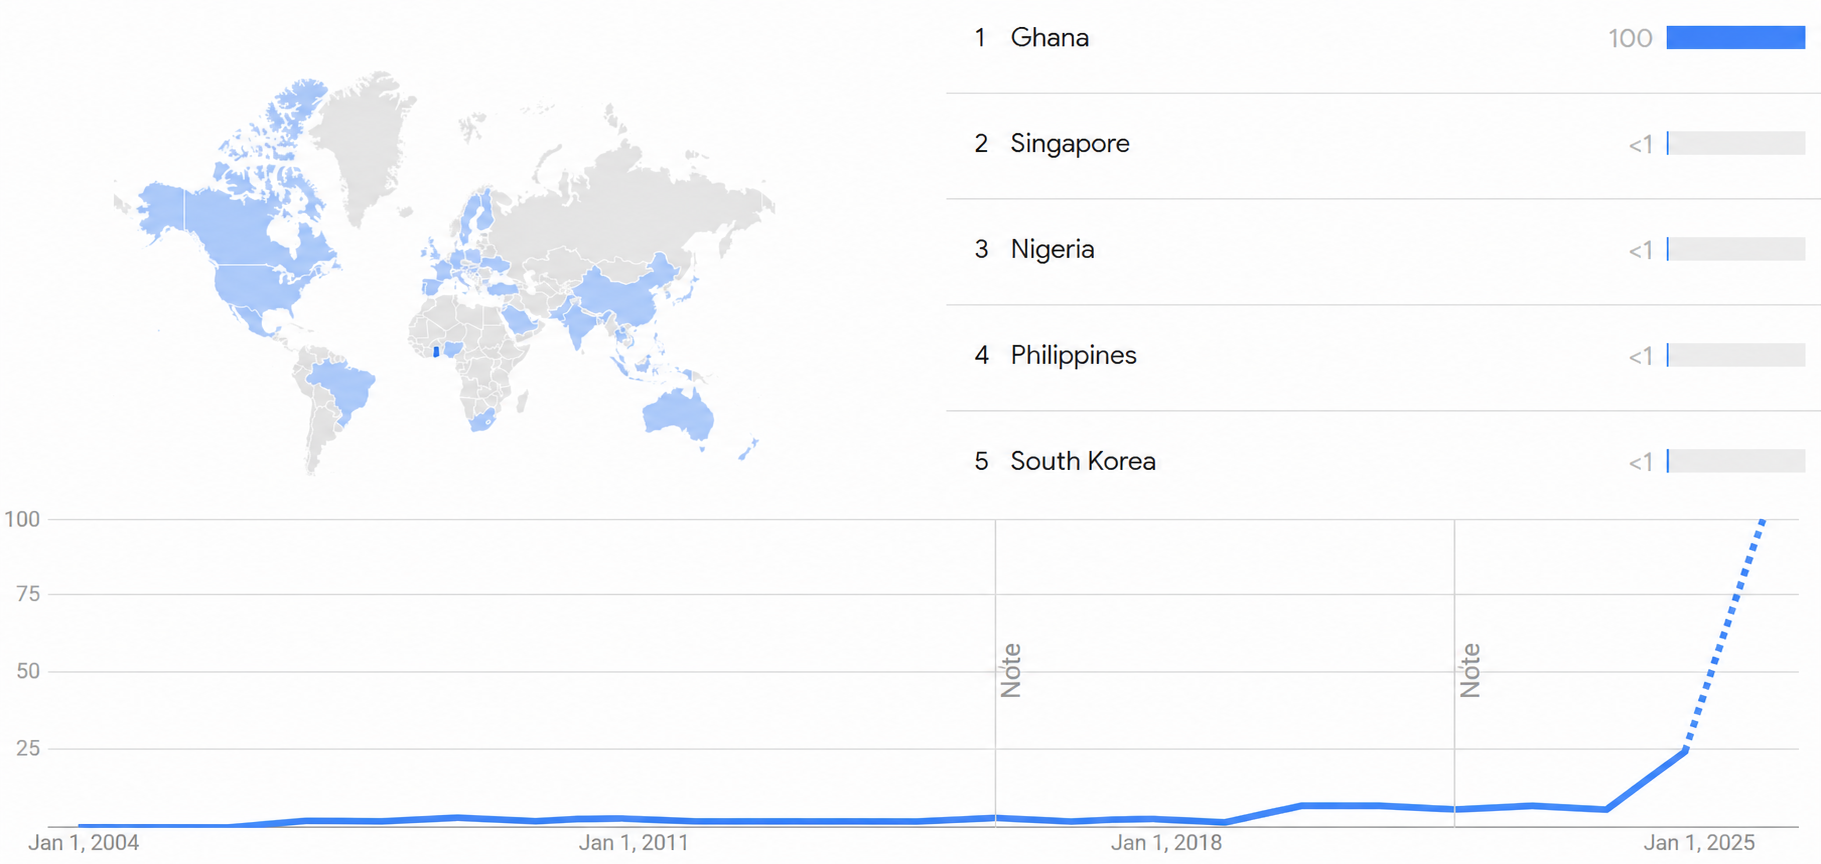
783 KB | Sebastian (talk | contribs) | {{w|Google Trends}} data for worldwide search interest in "laboratory leak" from 2004 to the present shows a similarly event-driven pattern: search volume remains near zero for two decades, with only a marginal uptick around 2020, before rising sharply beginning around 2024–2025 and continuing to climb steeply through the most recent available data. Regional breakdown shows the highest relative search interest concentrated in Ghana, followed by much lower levels in Singapore, Nigeria, the Phi... | 1 |
| 02:41, 30 July 2026 | Laboratory-leak-google-ngram-viewer.JPG (file) |  |
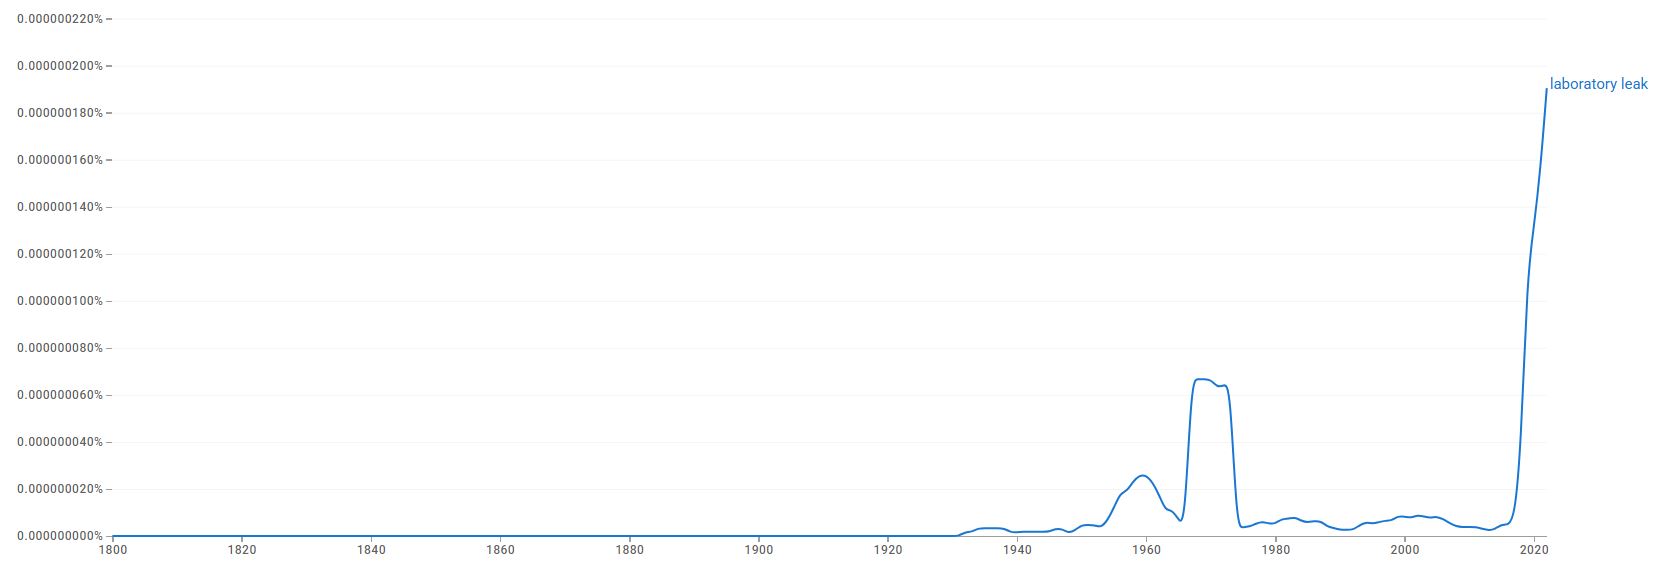
48 KB | Sebastian (talk | contribs) | Historical {{w|Google Ngram Viewer}} data tracking the phrase "laboratory leak" across English-language books from 1800–2022 shows the term is essentially absent before the 1930s, after which it registers three distinct waves of usage. A modest bump appears from roughly the mid-1930s through the mid-1940s, plausibly reflecting early occupational biosafety discourse of the kind documented in the {{w|Sulkin}} and {{w|Pike}} era of this timeline. A markedly larger plateau follows from roughly 19... | 1 |
| 00:20, 30 July 2026 | Lab-leak-wikipedia-views.JPG (file) |  |
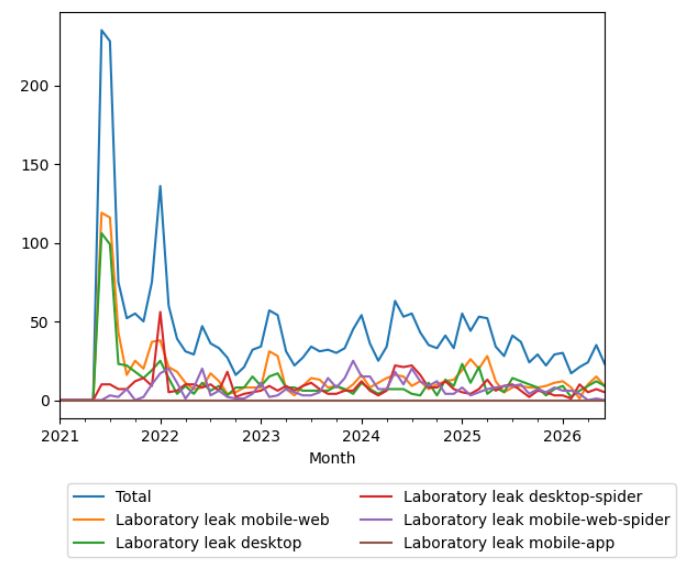
43 KB | Sebastian (talk | contribs) | Monthly {{w|Wikipedia}} pageview data for the "{{w|Laboratory leak}}" article — covering the English-language edition across 66 months from January 2021 through June 2026, broken down by desktop, mobile web, mobile app, and spider/bot traffic — shows a sharp spike in reader interest beginning around May–June 2021, reaching over 200 daily views at its peak — coinciding with {{w|President Joe Biden}}'s May 26, 2021 directive ordering the {{w|U.S. Intelligence Community}} to intensify its invest... | 1 |
| 18:20, 28 July 2026 | Mesa-optimizer-google-trend.JPG (file) |  |
25 KB | Sebastian (talk | contribs) | The chart illustrates global search interest in "mesa optimizer" over the past five years, current as of the screenshot date.<ref>{{cite web |title=mesa optimizer |website=Google Trends |url=https://trends.google.com/explore?q=mesa%20optimizer&date=today%205-y&geo=Worldwide |access-date=2026-07-28}}</ref> Interest remains negligible from 2021 through mid-2025, before rising sharply in the second half of 2025 to a local peak, then dipping briefly around the start of 2026, followed by a steep c... | 1 |
| 00:40, 27 July 2026 | Transformer-wikipedia-views.jpg (file) |  |
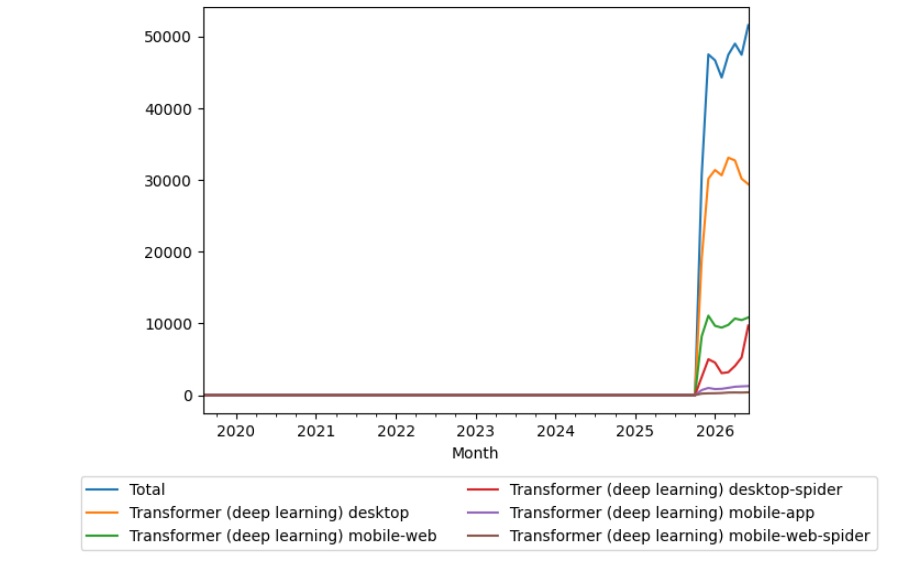
58 KB | Sebastian (talk | contribs) | The chart shows the number of views of the Wikipedia article on Transformer (deep learning) per month from 2019 to 2026. Views are negligible until late 2022, when the release of {{w|ChatGPT}} triggers a sharp spike — rising from under 1,000 monthly views to over 50,000 by early 2026 — reflecting the explosion of public interest in transformer-based AI following the ChatGPT launch.<ref>{{cite web |title=Wikipedia views for Transformer (deep learning)... | 1 |
| 21:22, 24 June 2026 | Physicalismngram.JPG (file) |  |
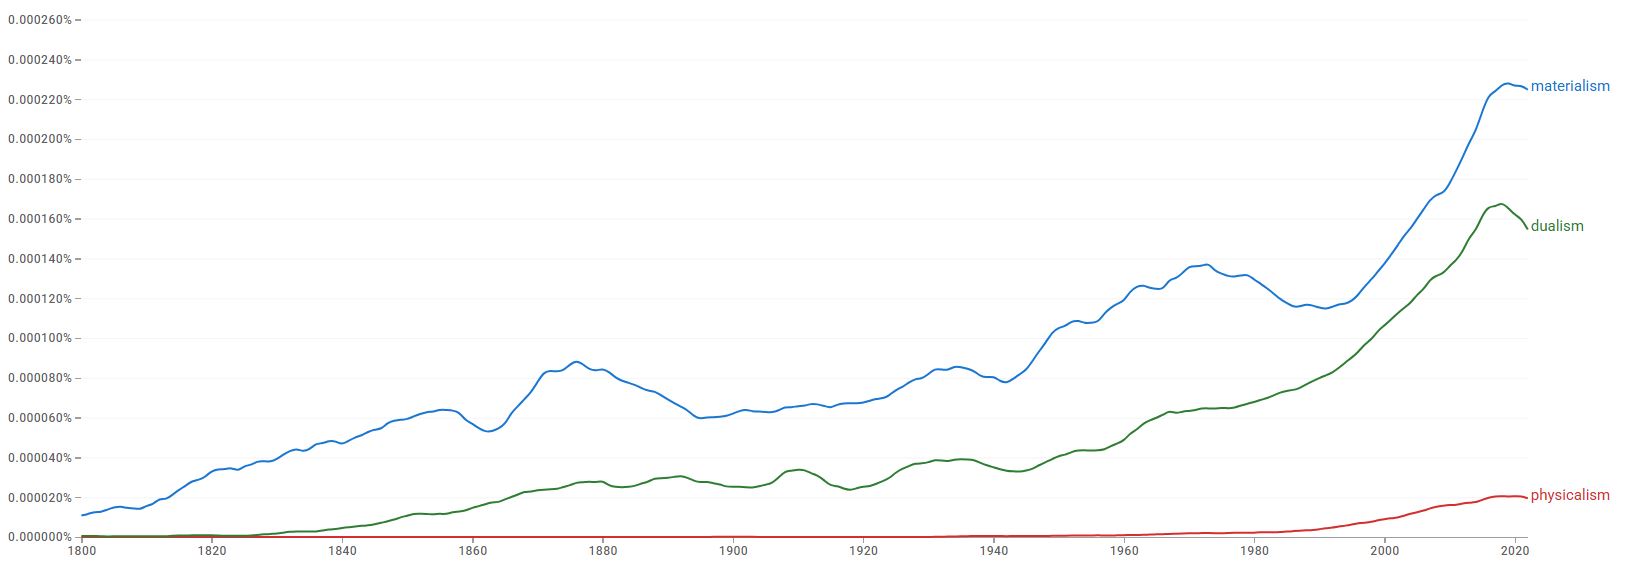
58 KB | Sebastian (talk | contribs) | The chart shows Google Ngram Viewer data for "materialism," "physicalism," and "dualism" in the English-language book corpus, from 1800 to 2022.<ref name="ngram-materialism-physicalism-dualism">{{cite web |url=https://books.google.com/ngrams/graph?content=materialism%2Cphysicalism%2Cdualism&year_start=1800&year_end=2022&corpus=en&smoothing=3 |title=Google Books Ngram Viewer: materialism, physicalism, dualism |website=Google Books Ngram Viewer |access-date=2026-06-24}}</ref> "Materialism" has... | 1 |
| 18:56, 24 June 2026 | Physicalismgoogletrends.jpg (file) |  |
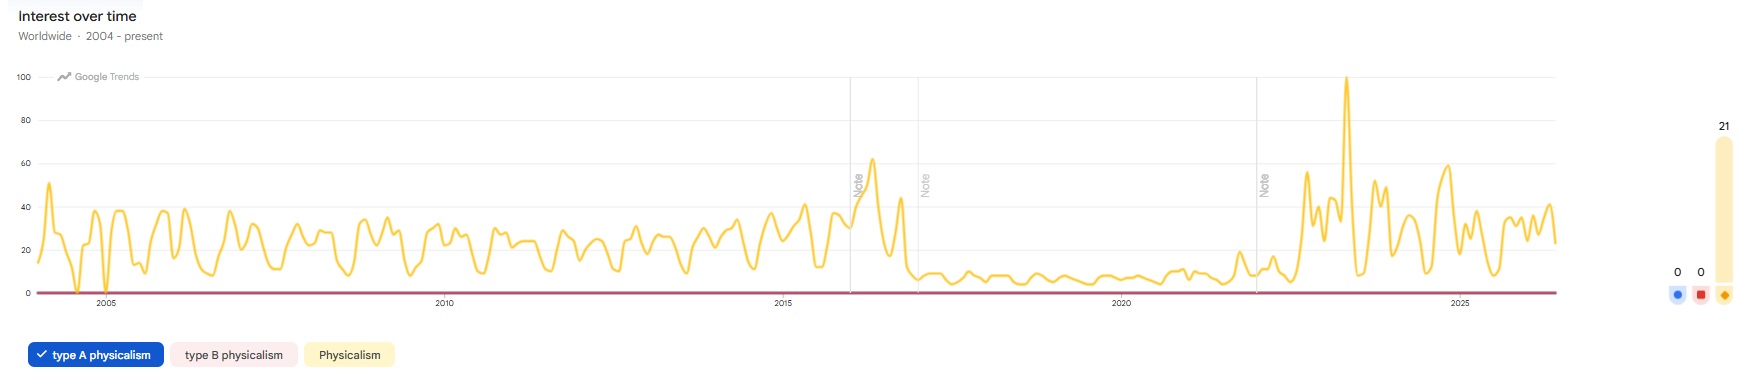
67 KB | Sebastian (talk | contribs) | The chart shows Google Trends data for "type A physicalism" and "type B physicalism" (search terms) alongside "Physicalism" (Topic), worldwide, from 2004 to the present, when the screenshot was taken.<ref name="googletrends-physicalism">{{cite web |url=https://trends.google.com/explore?q=type%2520A%2520physicalism%2Ctype%2520B%2520physicalism%2C%2Fm%2F05vn1&date=all&geo=Worldwide |title=Google Trends: type A physicalism, type B physicalism, Physicalism (Topic) |website=Google Trends |access-d... | 1 |
| 17:33, 20 June 2026 | Currenciesgoogletrends.png (file) |  |
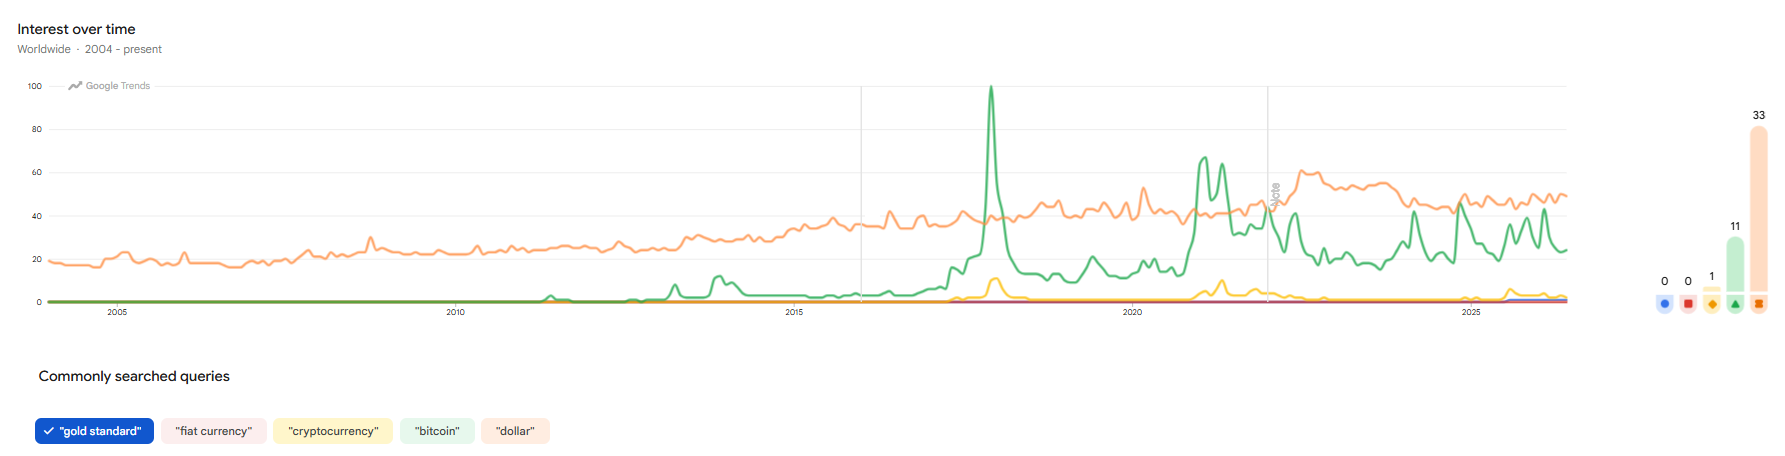
72 KB | Sebastian (talk | contribs) | The chart shows worldwide search interest for "gold standard", "fiat currency", "cryptocurrency", "bitcoin", and "dollar" from 2004 to the present. "Dollar" dominates throughout as the most consistently searched term, averaging well above the others, while "bitcoin" shows the most dramatic volatility — a sharp spike in late 2017 coinciding with that year's speculative peak, followed by recurring surges in 2021, 2024, and 2025 tracking subsequent bull markets. "Gold standard", "fiat currency",... | 1 |
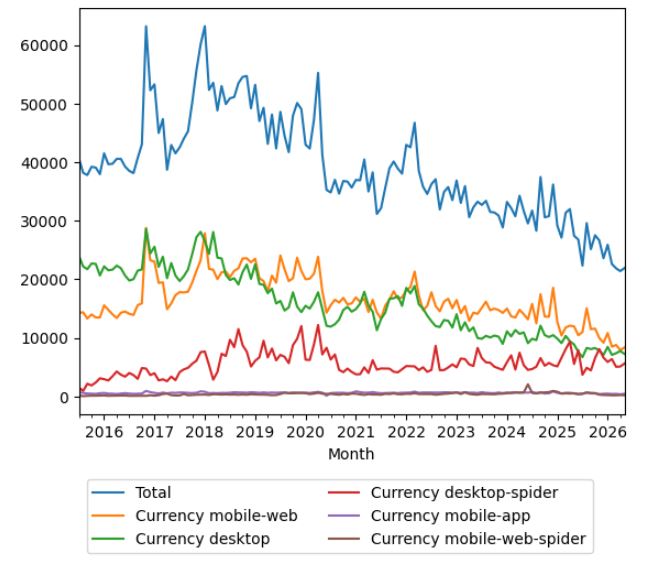
| 16:37, 20 June 2026 | Currencieswikipediaviews.JPG (file) |  |
53 KB | Sebastian (talk | contribs) | The chart shows monthly pageviews for the Wikipedia article on Currency from 2015 to 2026, broken down by platform. Total views peak above 60,000 in late 2016 and early 2018, coinciding with the height of public interest in cryptocurrency and the 2017–2018 Bitcoin bull run, before declining unevenly to around 20,000–30,000 by the mid-2020s. Desktop and mobile-web traffic dominate throughout and track each other closely, both showing the same 2016–2018 spikes, while desktop-spider (automated c... | 1 |
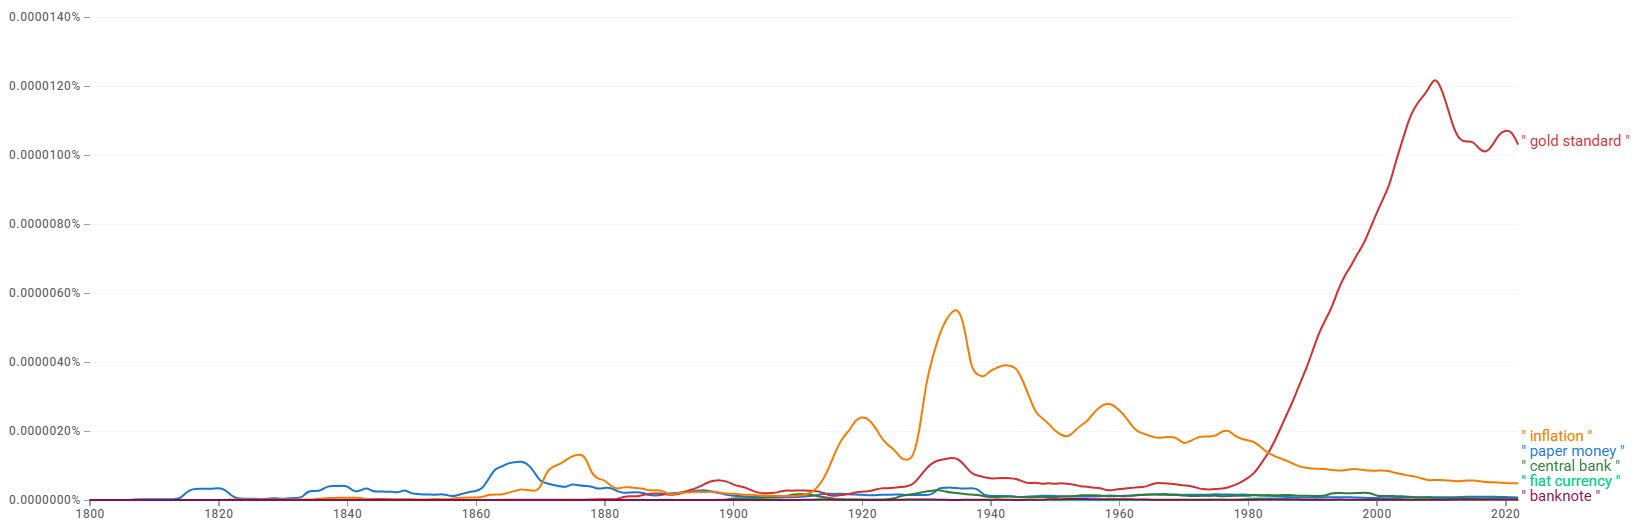
| 16:08, 20 June 2026 | Timelineofcurrenciesngram.JPG (file) |  |
51 KB | Sebastian (talk | contribs) | The chart shows the relative frequency of "gold standard", "inflation", "paper money", "central bank", "fiat currency", and "banknote" in the Google Books corpus from 1800 to 2019. "Inflation" rises sharply during the 1920s–1930s and again in the 1970s, tracking the timeline's currency crisis and Nixon shock rows. "Gold standard" remains a minor term until the 1980s, then climbs steeply through the 2000s and 2010s — likely reflecting retrospective debate and commentary on the system well afte... | 1 |
| 23:40, 15 May 2026 | Timelineofaiinprogramminggoogletrends.JPG (file) |  |
29 KB | Sebastian (talk | contribs) | The chart shows {{w|Google Trends}} data for the search term "AI in programming" worldwide over the past five years, with search interest normalized to a peak of 100. Search interest remains near zero through 2021–2022, rises gradually through 2023–2024 as GitHub Copilot and ChatGPT gain mainstream adoption, then surges sharply in 2025–2026 coinciding with the emergence of agentic coding tools, the coining of "vibe coding" by Andrej Karpathy, and widespread mainstream press coverage of AI's i... | 1 |
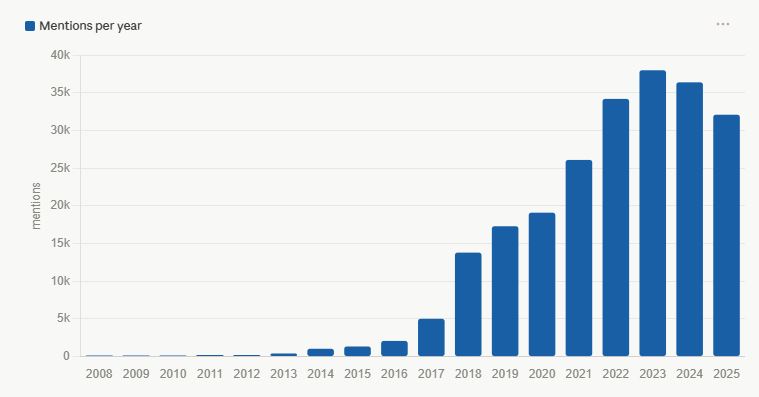
| 02:01, 14 May 2026 | Timelineofcriptocurrenciesgooglescholarmay2026.JPG (file) |  |
28 KB | Sebastian (talk | contribs) | The table summarizes per-year mentions on Google Scholar as of May 13, 2026. | 1 |
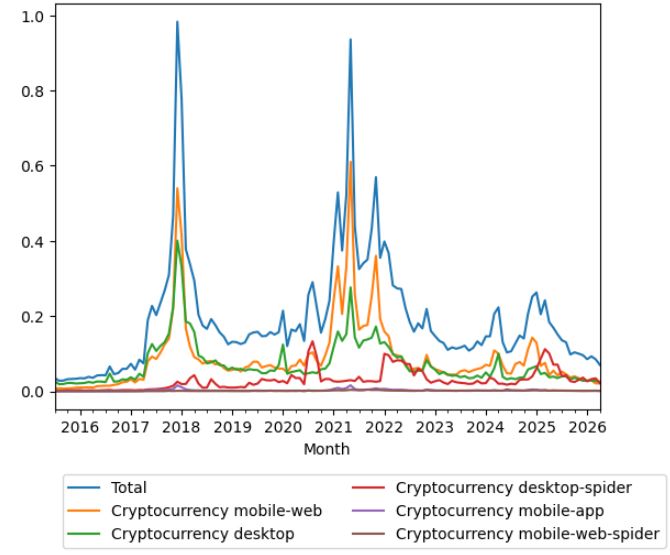
| 01:37, 14 May 2026 | Timelineofcryptocurrencieswikipediaviewsmay2026.JPG (file) |  |
47 KB | Sebastian (talk | contribs) | The chart below shows pageviews of the English Wikipedia article {{w|Cryptocurrency}}, from July 2015 to May 2026, broken down by access method: total (blue), desktop (green), mobile-web (orange), desktop-spider (red), mobile-app (purple), and mobile-web-spider (brown). The y-axis is scaled at 1e6 (millions of pageviews). The chart shows three distinct spikes: a first major peak approaching 1 million monthly pageviews around late 2017 to early 2018 coinciding with Bitcoin's surge toward $20,0... | 1 |
| 01:29, 14 May 2026 | Timelineof cryptocurrenciesgooglengramviewer2022.JPG (file) |  |
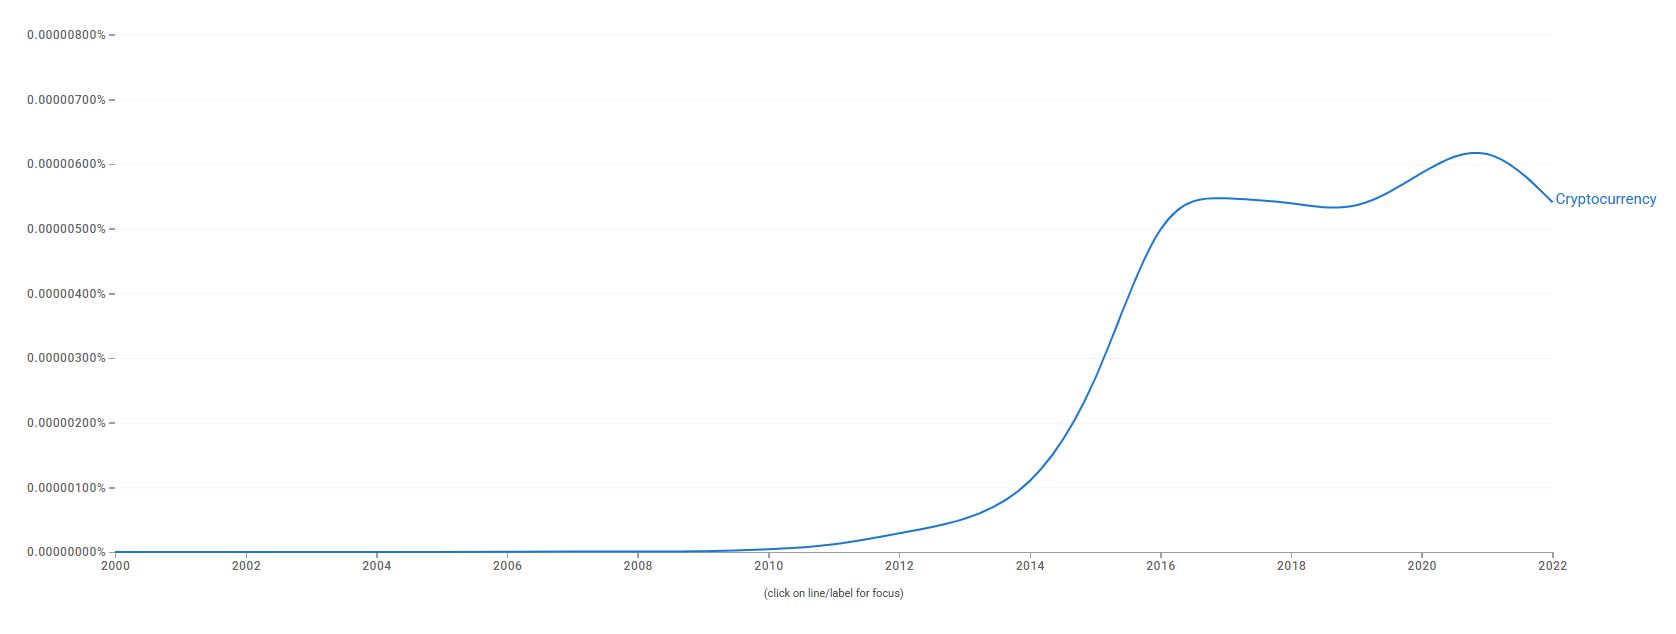
45 KB | Sebastian (talk | contribs) | The chart shows {{w|Google Ngram Viewer}} data for Cryptocurrency, from 2000 to 2022, in the English (2019) corpus with smoothing applied. The y-axis shows the term's frequency as a proportion of all words in English-language books. The chart shows effectively zero occurrence through 2009, the beginning of a steep rise from around 2013 coinciding with Bitcoin's first major price milestone and mainstream press coverage, a sharp acceleration from 2014 through 2016 as Ethereum and the broader al... | 1 |
| 01:16, 14 May 2026 | Timelineofcryptocurrenciesgoogletrends2026.JPG (file) |  |
32 KB | Sebastian (talk | contribs) | The chart shows {{w|Google Trends}} data for Cryptocurrency (Topic), worldwide, from January 1, 2015 to May 13, 2026, when the screenshot was taken. Interest is indexed on a scale of 0 to 100, where 100 represents peak search interest. The chart shows modest early interest from 2015 through 2017, a first major spike around the 2017–2018 bull market and ICO boom, sustained elevated interest through 2020–2021, a dramatic peak reaching the index maximum of 100 around late 2024 to early 2025 — co... | 1 |
| 05:23, 9 May 2026 | Computedoublingtimes.JPG (file) |  |
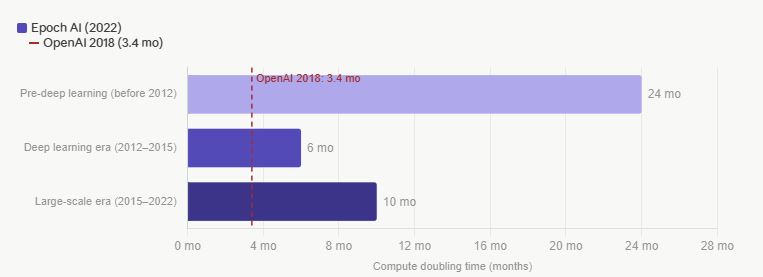
18 KB | Sebastian (talk | contribs) | The following chart displays the training compute doubling time — the number of months required for the amount of compute used in the largest AI training runs to double — across three distinct eras identified by {{w|Epoch AI}}'s 2022 analysis of over 120 notable machine learning models. The pre-deep learning era (before 2012) saw a doubling time of approximately 24 months, broadly consistent with {{w|Moore's law}}. The deep learning era (2012–2015), initiated by the AlexNet result at ImageNet... | 1 |
| 05:10, 9 May 2026 | Metaculus3479trajectory.JPG (file) |  |
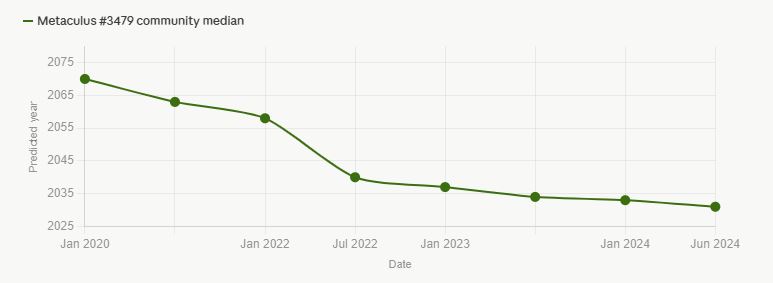
17 KB | Sebastian (talk | contribs) | The chart shows the trajectory of the community median prediction on Metaculus question #3479 — "When will the first weakly general AI system be devised, tested, and publicly announced?" — from January 2020 to June 2024. The question defines weakly general AI using four operational criteria: reliably passing an adversarial Turing test, scoring at or above the 75th percentile on a standard SAT mathematics section, achieving 90% accuracy on the Winograd Schema Challenge, and demonstrating gener... | 1 |
| 05:06, 9 May 2026 | ExpertsurveyHLMImedians.JPG (file) |  |
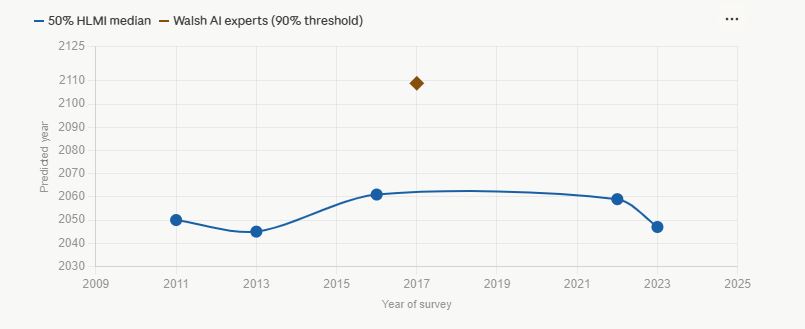
22 KB | Sebastian (talk | contribs) | The chart plots the aggregate median prediction for high-level machine intelligence (HLMI) — defined in each survey as the point at which unaided machines can accomplish every task better and more cheaply than human workers — from six major expert surveys conducted between 2011 and 2023. The blue line connects the 50% probability ("median") estimates from surveys of the broader AI research community; the brown diamond shows the Walsh 2017 AI expert group's 90% probability threshold (2109), wh... | 1 |
| 02:53, 9 May 2026 | Predictedyearvsyearofprediction.JPG (file) |  |
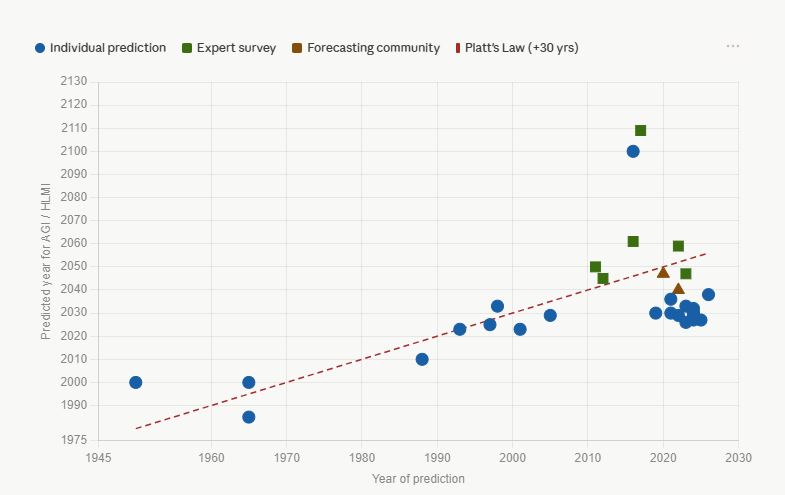
35 KB | Sebastian (talk | contribs) | The following scatter plot displays AI timeline predictions from the timeline of AI timelines, plotting each predictor's year of publication on the horizontal axis against their predicted year for human-level machine intelligence, AGI, or transformative AI on the vertical axis. Three categories of predictor are distinguished: individual predictions (blue circles), expert surveys (green squares), and forecasting community aggregates (brown triangles). The dashed red line represents Platt's Law... | 1 |
| 02:27, 25 March 2026 | Machinelearninggoogletrendsmarch2026.JPG (file) |  |
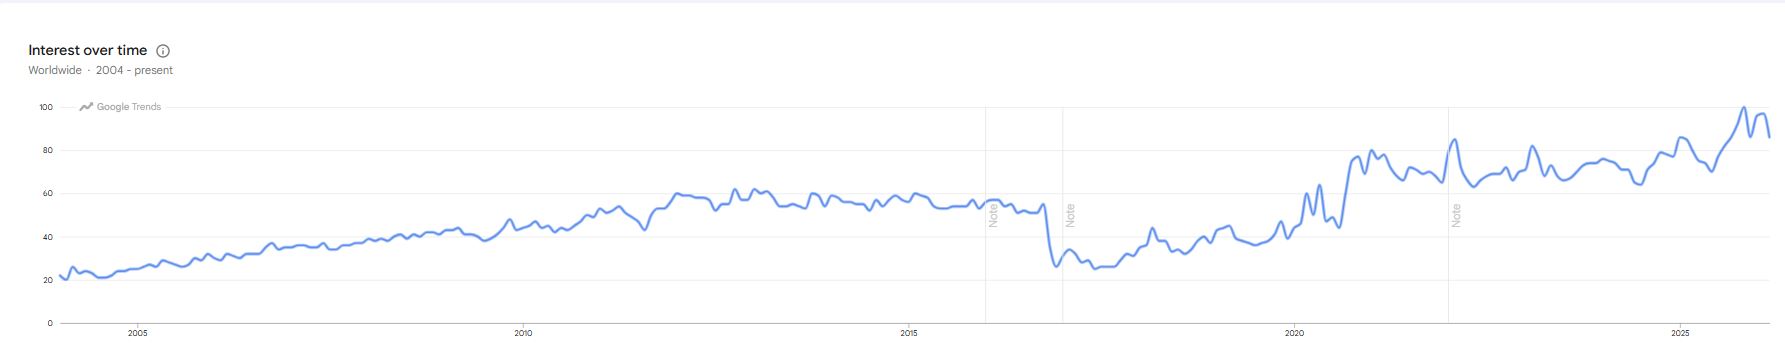
31 KB | Sebastian (talk | contribs) | This chart shows worldwide Google Trends interest in “Machine learning” from 2004 to 2026. It indicates low early attention, steady growth after the mid-2010s, and sharp increases in the 2020s, culminating in a peak around 2025–2026, reflecting accelerating public awareness, adoption, and discourse surrounding machine learning technologies and applications globally.<ref>{{cite web |title=Google Trends: Machine learning (worldwide search interest) |url=https://trends.google.com/explore?q=%2Fm%... | 1 |
| 01:30, 25 March 2026 | Machinelearningwikipediaviewsmarch2026.JPG (file) |  |
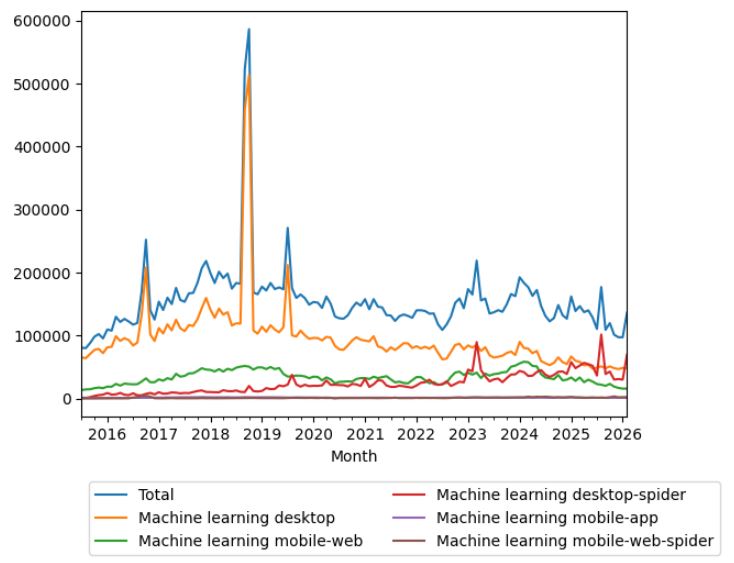
48 KB | Sebastian (talk | contribs) | This chart shows monthly Wikipedia pageviews for the {{w|Machine learning}} article from 2015 to 2026, segmented by access platforms (desktop, mobile web, mobile app, and spiders). It highlights overall traffic trends, seasonal fluctuations, and notable spikes, reflecting growing public interest and shifting patterns in how users access machine learning content online.<ref>{{cite web |title=Wikipedia Views: Machine learning page statistics |url=https://wikipediaviews.org/displayviewsformultip... | 1 |
| 13:38, 23 March 2026 | Vitamindgoogletrendsmarch2026.JPG (file) |  |
38 KB | Sebastian (talk | contribs) | The chart displays worldwide Google Trends interest in “Vitamin D” from 2004 to March 2026, when the screenshot was taken. Search interest shows a long-term upward trend, with periodic fluctuations and notable increases after 2020. The data suggests growing public attention, likely reflecting expanding research, health awareness, and media coverage related to vitamin D.<ref>{{cite web |title=Google Trends: "Vitamin D" search interest over time |url=https://trends.google.com/explore?q=%2Fm%2F0... | 1 |
| 13:07, 23 March 2026 | Vitamindwikipediaviewsmarch2026.JPG (file) |  |
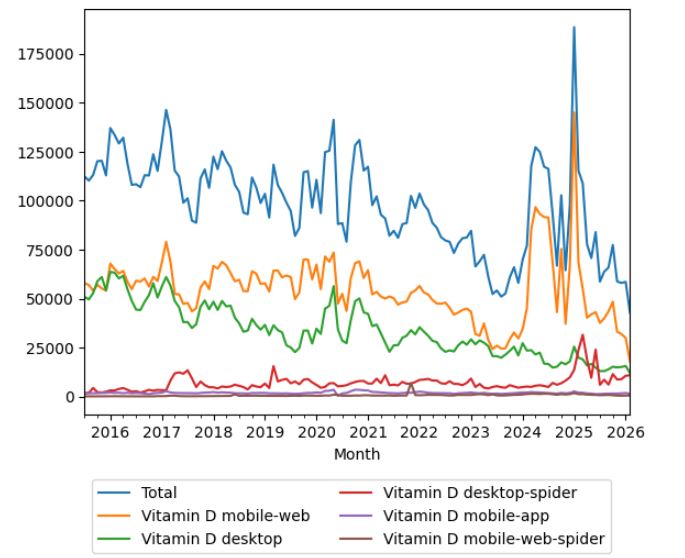
53 KB | Sebastian (talk | contribs) | This chart shows monthly Wikipedia pageviews for the article “Vitamin D,” disaggregated by access platform (desktop, mobile web, and app) and spider traffic. Total views fluctuate over time, with notable spikes around 2024–2025, while long-term trends indicate declining desktop usage and relatively stable mobile access across the observed period.<ref>{{cite web |title=Wikipedia pageviews analysis for "Vitamin D" |url=https://wikipediaviews.org/displayviewsformultiplemonths.php?page=Vitamin+D&... | 1 |
| 21:35, 24 February 2026 | Claudewikipediaviewsfebruary2026.jpg (file) |  |
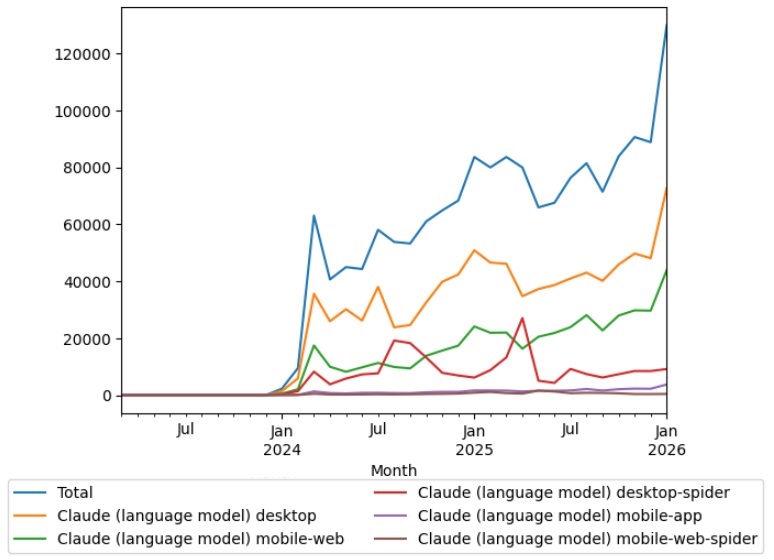
73 KB | Sebastian (talk | contribs) | The chart shows monthly Wikipedia pageviews for Claude (language model) across desktop, mobile web, and mobile app platforms. It illustrates growth in reader interest from March 2023 to early 2026, highlighting spikes associated with major releases, increased media coverage, and broader public attention to Anthropic’s AI models.<ref>{{cite web |title=Wikipedia pageviews for "Claude (language model)" (Jan 2023–Jan 2026) |url=https://wikipediaviews.org/displayviewsformultiplemonths.php?page=Cla... | 1 |
| 20:08, 22 February 2026 | Claudegoogletrendsfebruary2026.JPG (file) |  |
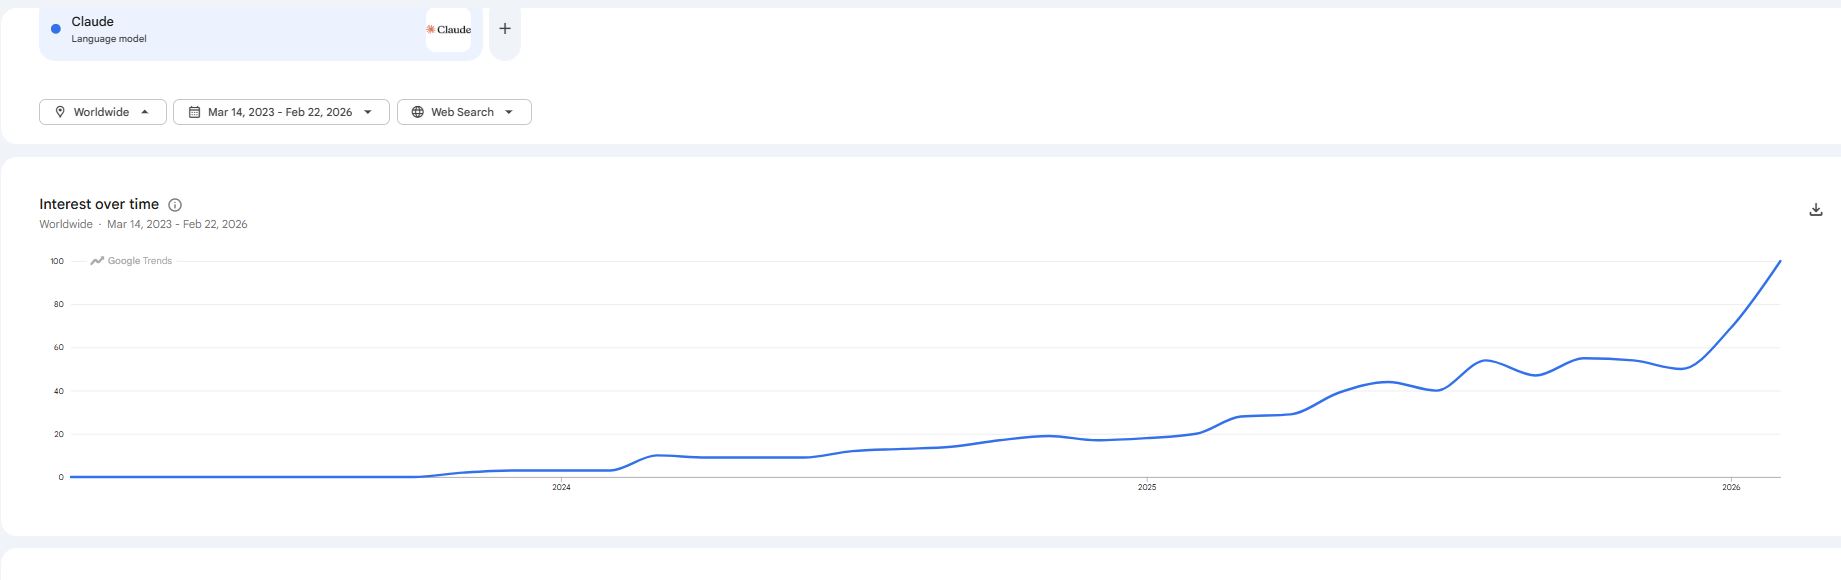
47 KB | Sebastian (talk | contribs) | This graph shows worldwide Google Trends interest in Claude from March 2023 to February 2026. Public attention remains minimal through 2023, rises gradually during 2024, and accelerates sharply through 2025 and early 2026, reflecting growing visibility, adoption, and relevance of Anthropic’s language model. | 1 |
| 00:28, 8 February 2026 | Calorierestrictionwikipediaviewsfebruary2026.jpg (file) |  |
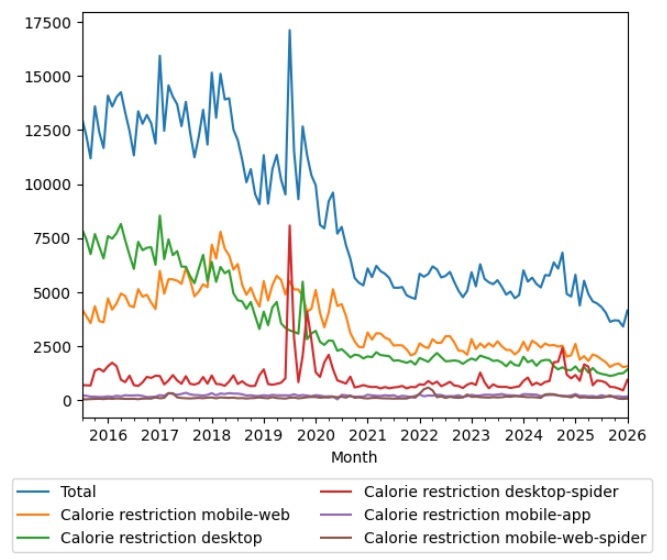
87 KB | Sebastian (talk | contribs) | The chart below shows pageviews of the English Wikipedia article {{w|Calorie restriction}}, from July 2015 to February 2026.<ref>{{cite web |title=Calorie restriction |url=https://wikipediaviews.org/displayviewsformultiplemonths.php?page=Calorie+restriction&allmonths=allmonths-api&language=en&drilldown=all|website=wikipediaviews.org |access-date=28 June 2021}}</ref> | 1 |
| 00:20, 8 February 2026 | Calorierestrictiongoogletrendsfebruary2026.png (file) |  |
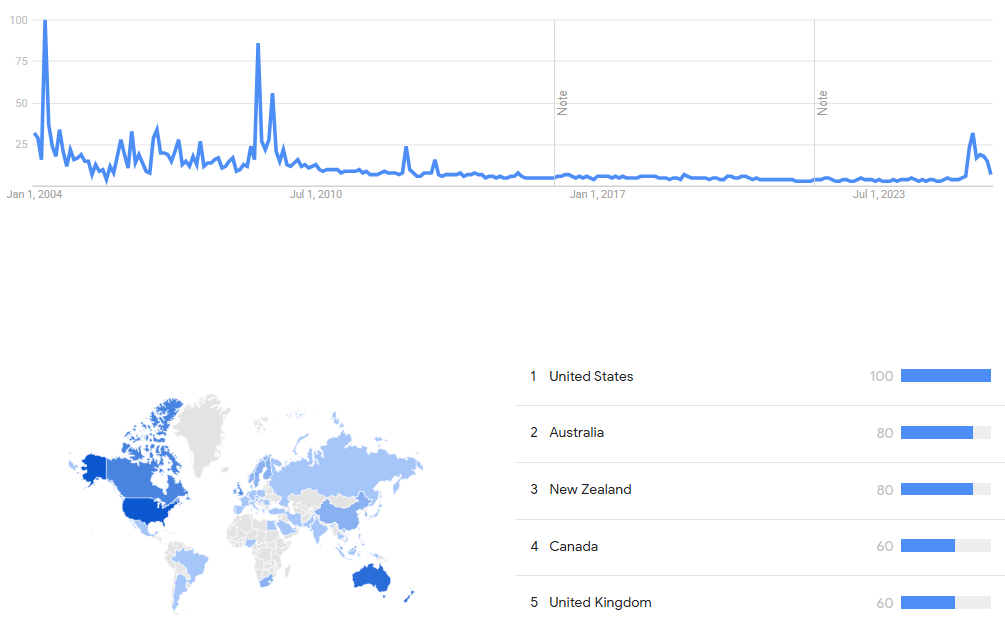
58 KB | Sebastian (talk | contribs) | The chart shows {{w|Google Trends}} data for Calorie restriction (search term), from January 2004 to February 2026, when the screenshot was taken. Interest is also ranked by country and displayed on world map <ref>{{cite web |title=Calorie restriction |url=https://trends.google.com/trends/explore?date=all&q=Calorie%20restriction|website=Google Trends |access-date=7 February 2026}}</ref>. | 1 |
| 05:04, 29 January 2026 | Nutritionalsupplementsgoogletrendsjanuary2026.png (file) |  |
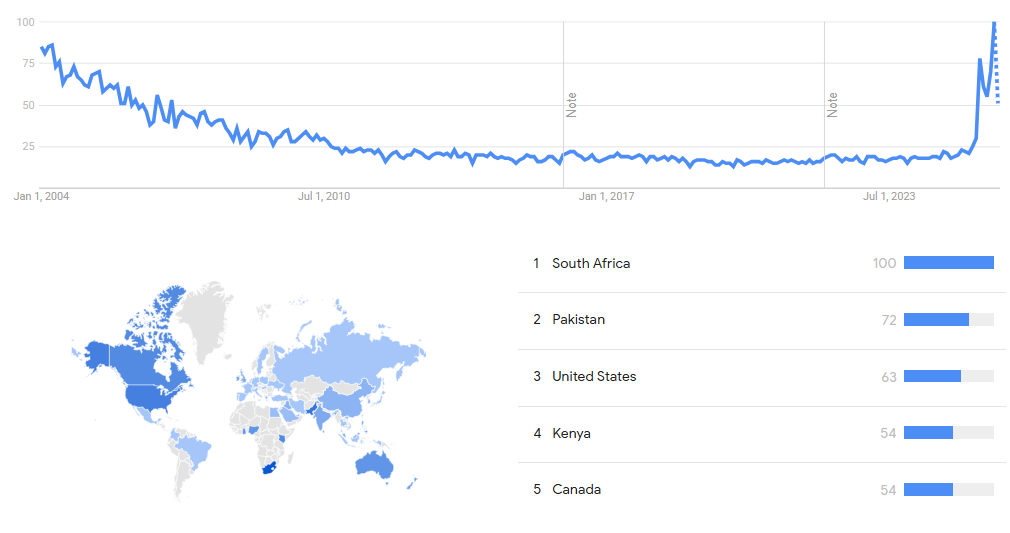
56 KB | Sebastian (talk | contribs) | The Google Trends graph for “nutritional supplement” shows a long-term decline in search interest from 2004 through the mid-2010s, followed by a prolonged low, stable plateau. Beginning in late 2023–2024, interest rises sharply, reaching the highest peak in the entire series, indicating a sudden surge in public attention.<ref>{{cite web |title=Google Trends: "nutritional supplement" |url=https://trends.google.com/trends/explore?date=all&q=nutritional%20supplement |website=Google Trends |publi... | 1 |
| 05:01, 27 January 2026 | Nutritionalsupplementswikipediaviewsjanuary2026.jpg (file) |  |
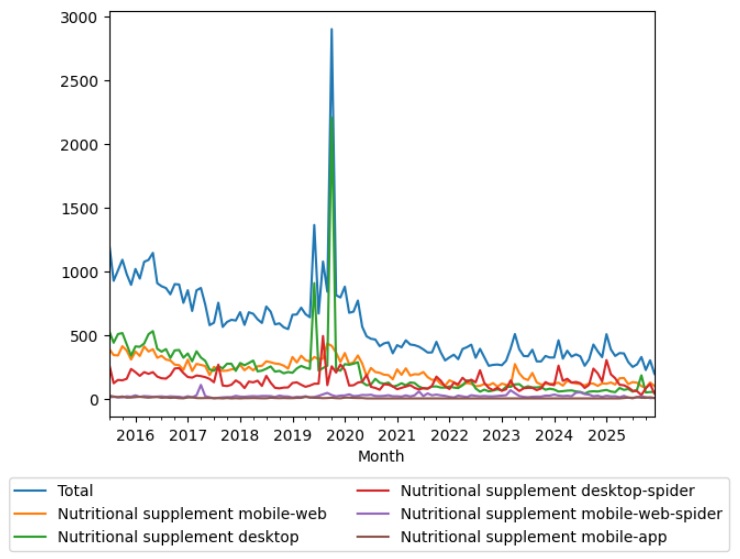
76 KB | Sebastian (talk | contribs) | The chart shows pageviews of the English Wikipedia article {{w|nutritional supplement}}, from July 2015 to December 2025.<ref>{{cite web |title=Wikipedia Views: “Nutritional supplement” (pageviews, all months, English Wikipedia) |url= https://wikipediaviews.org/displayviewsformultiplemonths.php?page=Nutritional+supplement&allmonths=allmonths-api&language=en&drilldown=all |website=wikipediaviews.org |accessdate=27 January 2026}}</ref> | 1 |
| 04:54, 27 January 2026 | Nutritionalsupplementsgooglengramjanuary2026.JPG (file) |  |
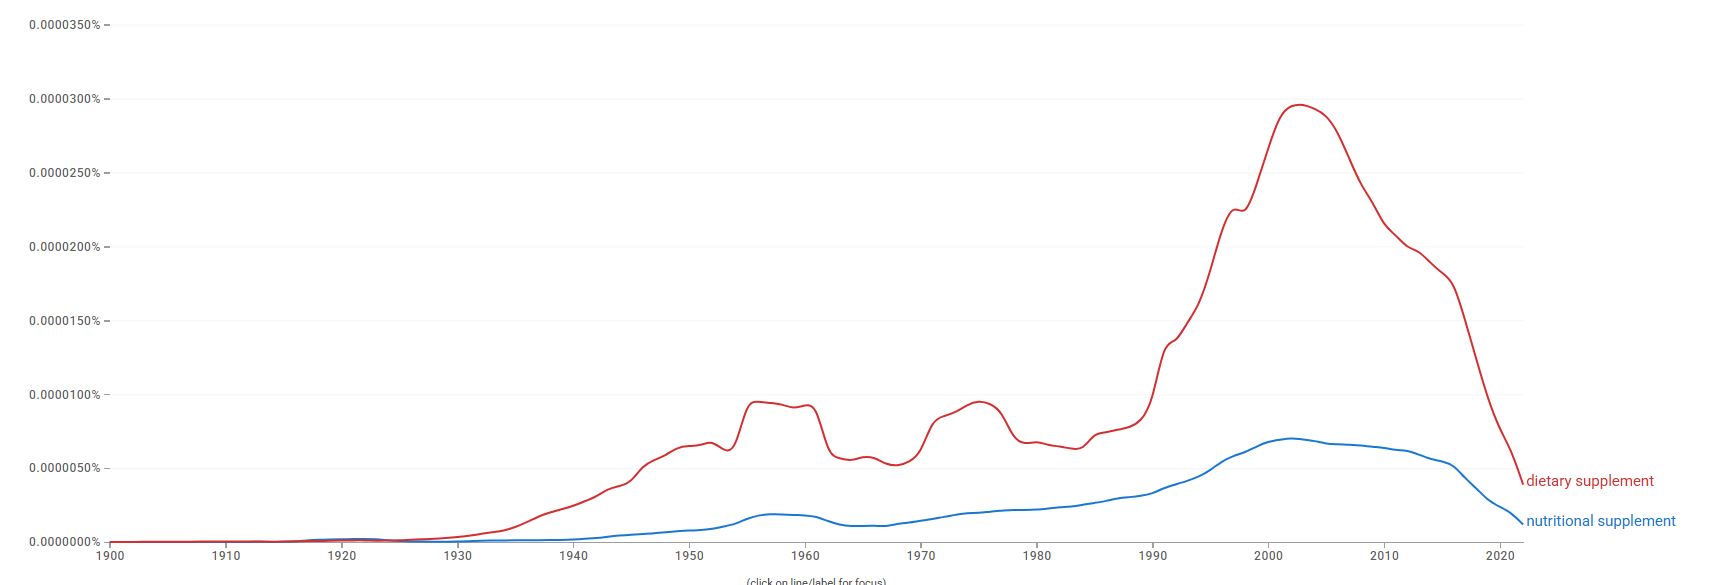
49 KB | Sebastian (talk | contribs) | The comparative chart shows Google Ngram Viewer data for nutritional supplement and dietary supplement from 1900 to 2022.<ref>{{cite web |title=Google Ngram Viewer graph: “nutritional supplement” and “dietary supplement” (1900–2022) |url=https://books.google.com/ngrams/graph?content=nutritional+supplement%2Cdietary+supplement&year_start=1900&year_end=2022&corpus=en-2019&smoothing=3&case_insensitive=false |website=Google Books Ngram Viewer |publisher=Google |accessdate=27 January 2026}}</ref> | 1 |
| 17:15, 27 December 2025 | Largelanguagemodelsgoogletrendsdecember2025.jpg (file) |  |
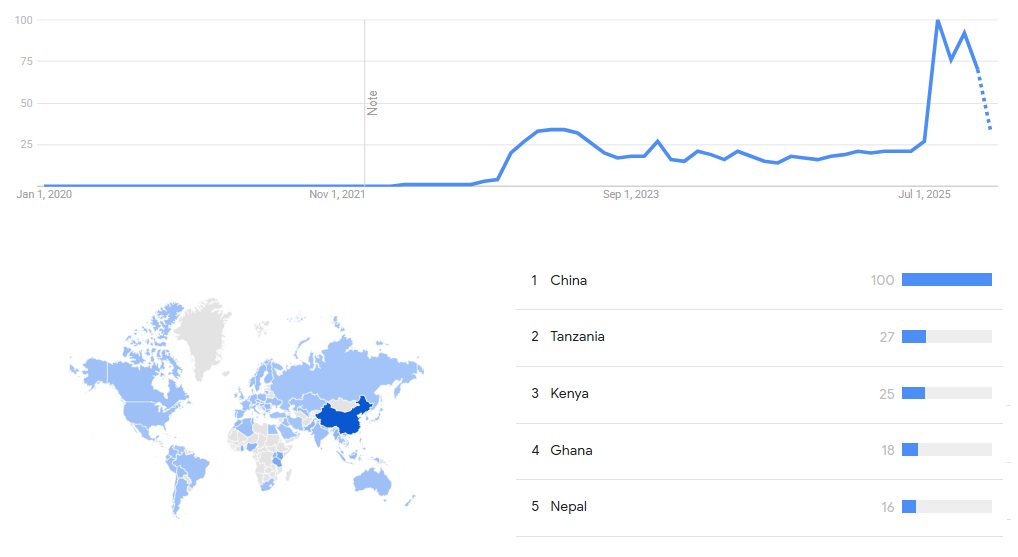
60 KB | Sebastian (talk | contribs) | The image below shows Google trends data for Large language model (topic), from January 2023 to December 2025, when the screenshot was taken. Interest is also ranked by country and displayed on world map.<ref>{{cite web |title=Google Trends explore: "/g/11kc9956b3" |url=https://trends.google.com/trends/explore?date=2023-01-01%202025-12-27&q=%2Fg%2F11kc9956b3&hl=en |website=Google Trends |publisher=Google |access-date=27 December 2025 |date=n.d. |note=Search interest over time for the specifie... | 1 |
| 16:33, 27 December 2025 | Largelanguagemodelswikipediaviewsdecember2025.jpg (file) |  |
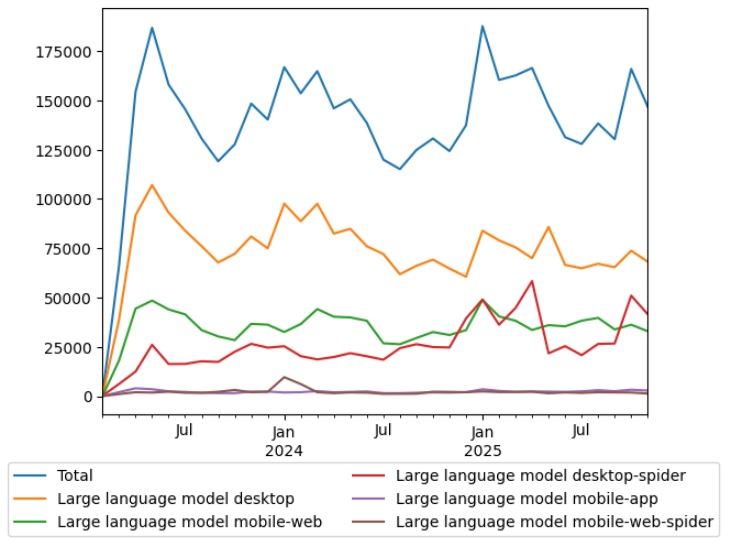
82 KB | Sebastian (talk | contribs) | The image below shows Wikipedia views data for the article {{w|Large language model}}, from February to November 2025.<ref>{{cite web |title=Wikipedia pageviews for "Large language model" |url=https://wikipediaviews.org/displayviewsformultiplemonths.php?page=Large+language+model&months[0]=202511&months[1]=202510&months[2]=202509&months[3]=202508&months[4]=202507&months[5]=202506&months[6]=202505&months[7]=202504&months[8]=202503&months[9]=202502&months[10]=202501&months[11]=202412&months[12]=... | 1 |
| 15:39, 22 December 2025 | Xaiwikipediaviewsdecember2025.jpg (file) |  |
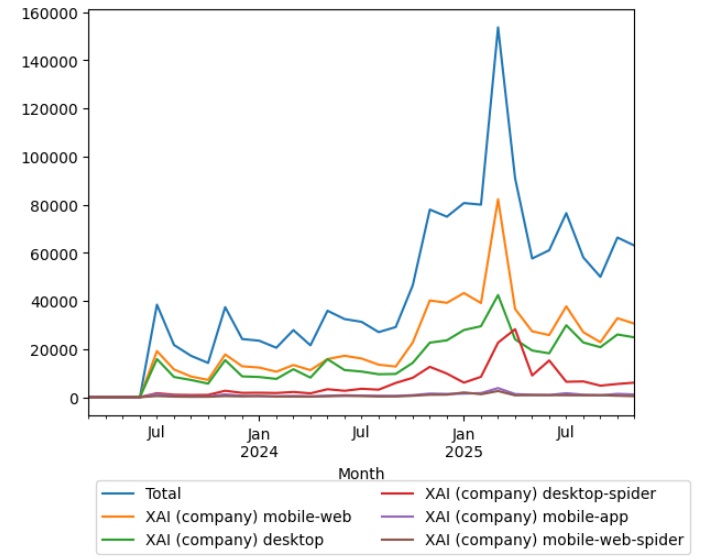
70 KB | Sebastian (talk | contribs) | This Wikipedia Pageviews chart shows monthly readership of the xAI company article across platforms from 2023 to 2025. It highlights modest early visibility, followed by a pronounced surge in early 2025, indicating rapidly growing public attention and information-seeking behavior surrounding xAI’s activities.<ref>{{cite web |title=Wikipedia Pageviews Analysis – XAI (company) |url=[https://wikipediaviews.org/displayviewsformultiplemonths.php?page=XAI+%28company%29&language=en&drilldown=all](ht... | 1 |
| 14:48, 22 December 2025 | Xaigoogletrendsdecember2025.jpg (file) |  |
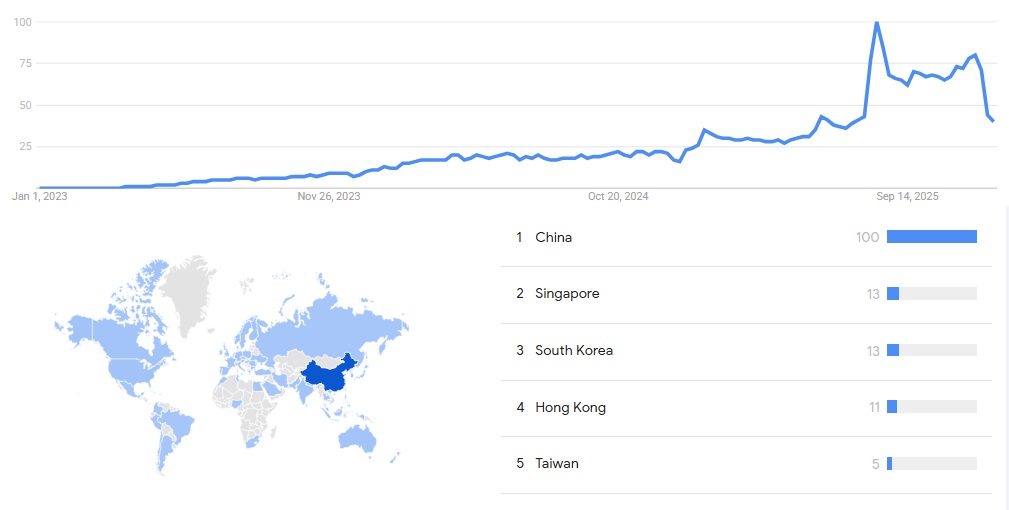
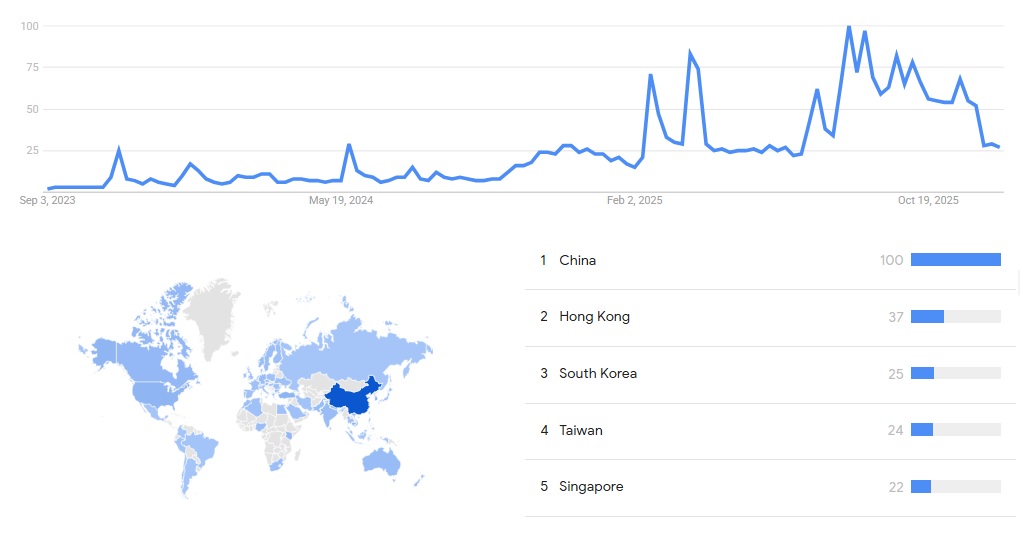
68 KB | Sebastian (talk | contribs) | The Google Trends chart illustrates global search interest in xAI from September 2023 to December 2025, when the screenshot was taken. It shows relatively low early attention, followed by sharp spikes in 2025, and highlights strong regional interest led by China, with notable engagement across East and Southeast Asia.<ref>{{cite web |title=xAI – Google Trends |url=[https://trends.google.com/trends/explore?date=2023-09-03%202025-12-22&q=%2Fg%2F11v5pdm3kg&hl=en](https://trends.google.com/trends... | 1 |
| 03:37, 19 December 2025 | Openaigoogletrendsdecember2025.jpg (file) |  |
59 KB | Sebastian (talk | contribs) | The chart shows {{w|Google Trends}} data for OpenAI (Artificial intelligence company), from January 2020 to December 2025, when the screenshot was taken. Interest is also ranked by country and displayed on world map. Data indicate minimal global interest in OpenAI from 2020 through late 2022, followed by a sharp structural break coinciding with the public release and mass adoption of ChatGPT. Interest rises steadily through 2023–2024, then spikes dramatically in mid-2025, aligning with the re... | 1 |
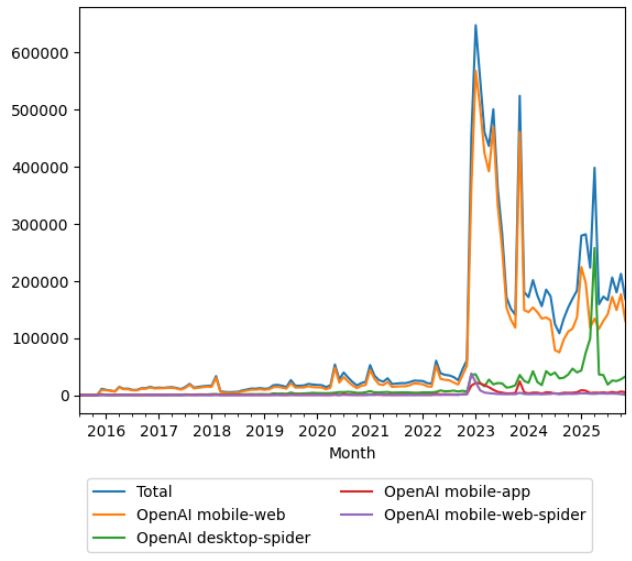
| 02:14, 19 December 2025 | Opnaiwikipediaviewsdecember2025.JPG (file) |  |
40 KB | Sebastian (talk | contribs) | The chart shows pageviews of the English Wikipedia article {{w|OpenAI}}, from July 2015 to November 2025. See spike of interest induced by ChatGPT release.<ref>{{cite web |title=Wikipedia pageview statistics for OpenAI |url=https://wikipediaviews.org/displayviewsformultiplemonths.php?page=OpenAI&allmonths=allmonths-api&language=en&drilldowns%5B0%5D=mobile-web&drilldowns%5B1%5D=mobile-app&drilldowns%5B2%5D=desktop-spider&drilldowns%5B3%5D=mobile-web-spider |website=wikipediaviews.org |accessda... | 1 |
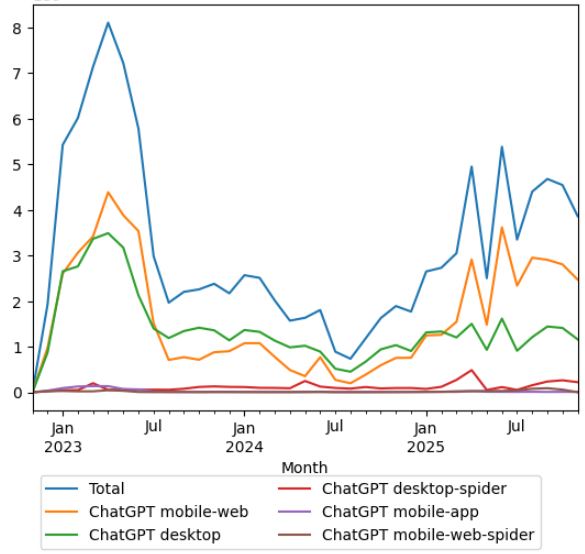
| 03:10, 18 December 2025 | Chatgptwikipediaviewsnovember2025.JPG (file) |  |
40 KB | Sebastian (talk | contribs) | The chart shows pageviews of the English Wikipedia article ChatGPT, from November 2022 to November 2025.<ref>{{cite web |title=ChatGPT pageviews statistics |url=https://wikipediaviews.org/displayviewsformultiplemonths.php?page=ChatGPT&months[0]=202511&months[1]=202510&months[2]=202509&months[3]=202508&months[4]=202507&months[5]=202506&months[6]=202505&months[7]=202504&months[8]=202503&months[9]=202502&months[10]=202501&months[11]=202412&months[12]=202411&months[13]=202410&months[14]=202409&mo... | 1 |