File:Robot-google-scholar.PNG
Jump to navigation
Jump to search
Size of this preview: 800 × 470 pixels. Other resolution: 863 × 507 pixels.
Original file (863 × 507 pixels, file size: 76 KB, MIME type: image/png)
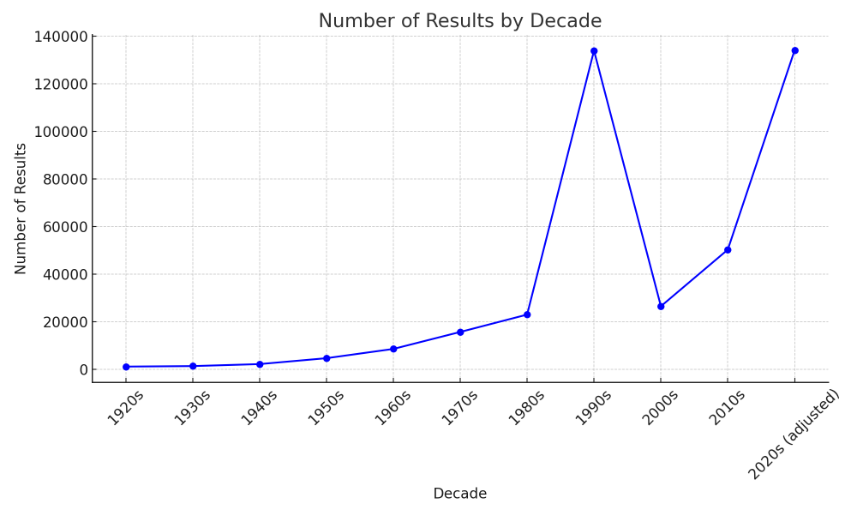
The graph illustrates the number of Google Scholar results per decade for the term "robot," beginning in the 1920s, the decade in which the term was first introduced. The figure for the 2020s has been adjusted to 134,200, based on a projection from 71,000 results found between January 2020 and April 16, 2025 (approximately 5.29 years).
File history
Click on a date/time to view the file as it appeared at that time.
| Date/Time | Thumbnail | Dimensions | User | Comment | |
|---|---|---|---|---|---|
| current | 19:51, 16 April 2025 | | 863 × 507 (76 KB) | Sebastian (talk | contribs) | The graph illustrates the number of Google Scholar results per decade for the term "robot," beginning in the 1920s, the decade in which the term was first introduced. The figure for the 2020s has been adjusted to 134,200, based on a projection from 71,... |
You cannot overwrite this file.
File usage
The following page uses this file: