File:Technical-analysis-google-ngram-viewer.PNG
Original file (1,672 × 572 pixels, file size: 35 KB, MIME type: image/png)
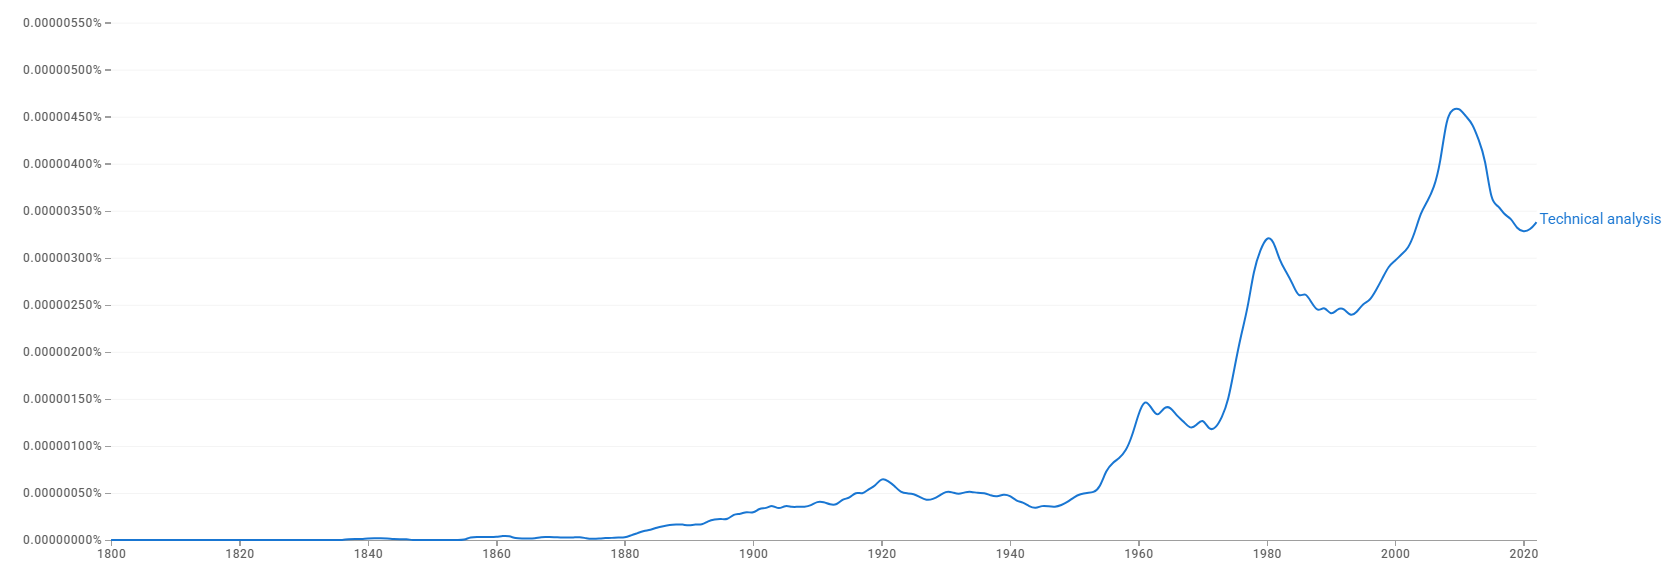
This Google Ngram Viewer chart shows the frequency of the term "technical analysis" in published books from 1800 to 2019. The term remained virtually unused until the early 20th century, began to appear modestly around the 1920s—likely reflecting the growth of financial markets—and then declined slightly mid-century. A sharp increase occurs after 1960, with notable peaks around 1980, the early 2000s, and a high point around 2010, possibly corresponding to rising public interest in stock trading and financial speculation. The post-2010 decline may reflect shifting terminology or changes in publishing trends. The term remains significantly more frequent than before 1960.[1]
- ↑ "Google Books Ngram Viewer: "Technical analysis"". Google Books Ngram Viewer. Google. Retrieved 1 May 2025.
File history
Click on a date/time to view the file as it appeared at that time.
| Date/Time | Thumbnail | Dimensions | User | Comment | |
|---|---|---|---|---|---|
| current | 16:06, 1 May 2025 | 1,672 × 572 (35 KB) | Sebastian (talk | contribs) | This Google Ngram Viewer chart shows the frequency of the term "technical analysis" in published books from 1800 to 2019. The term remained virtually unused until the early 20th century, began to appear modestly around the 1920s—likely reflecting the... |
You cannot overwrite this file.
File usage
The following page uses this file: